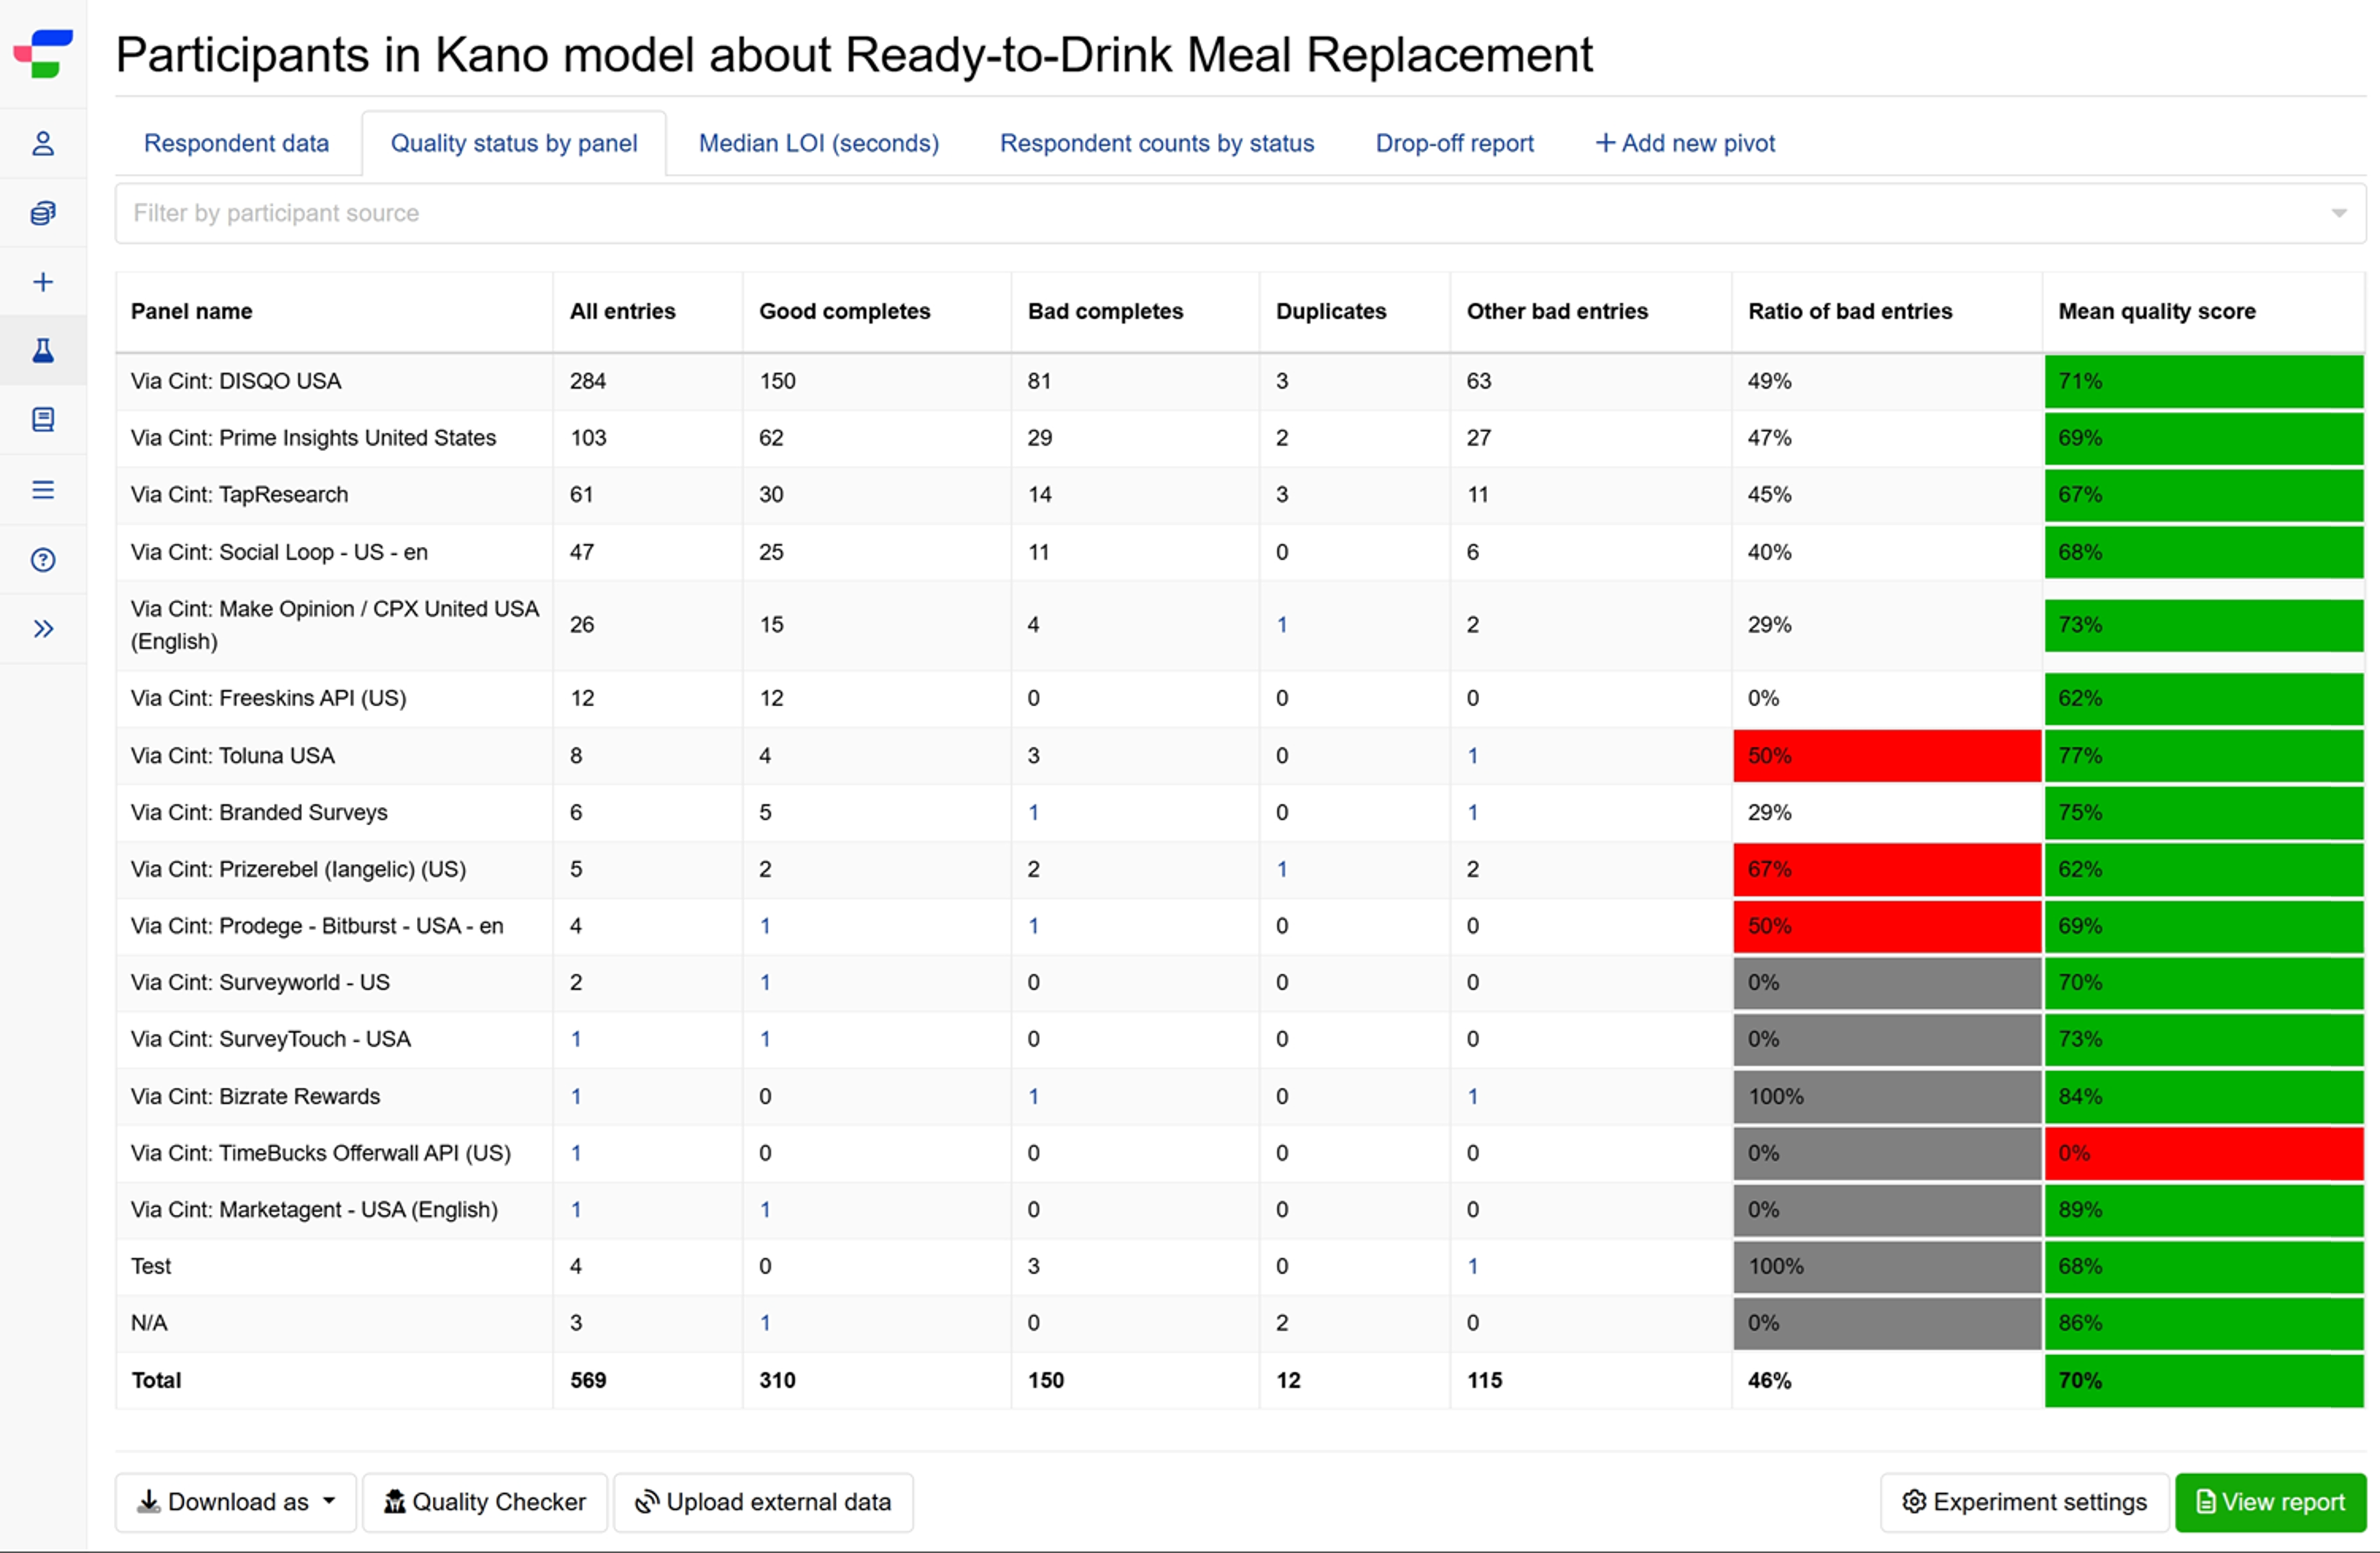
Reviewing quality status by panel
The Quality status by panel tab aggregates participant data by panel sources, providing insights into completion rates, quality scores, and potential response issues.
Simply get started by navigating to the Quality Status by Panel tab when you have participants from multiple sources. The dashboard automatically appears when your study includes participants with panel source information.

Understanding panel quality metrics
The table displays eight key columns that provide a comprehensive quality overview for each panel:
- Panel name.
- All entries displays the total participant count from that source.
- Good completes shows the count of participants who finished the study and passed all automated quality checks.
- Bad completes shows the count of participants who finished but failed quality assessments.
- Duplicates shows the count of entries flagged as potential duplicate submissions based on advanced detection algorithms.
- Other bad entries shows the count of incomplete responses with quality issues or validation failures.
- Ratio of bad entries, displayed as a percentage of problematic responses (bad completes + other bad entries) relative to all completed entries (good + problematic responses). The background turns red when this ratio reaches 50% or higher, and grey when all entries are bad or when the sample size is too small (fewer than 6 completed entries).
- Mean quality score for all participants from that panel. The background color indicates performance levels according to the quality assessment thresholds.
Test entries appear near the bottom of the list, followed by any unidentified sources marked as “NA.” The total row at the bottom provides overall study metrics.
Exporting panel data
To export the table into a .csv or .xlsx file, click on the button on the bottom-left of the page.