Evaluate responses with Quality score
Data cleaning involves identifying and removing responses that don’t meet your quality criteria, giving you confidence in your research outcomes.
Conjointly streamlines this process with automated checks that detect and flag poor-quality responses across all sample sources. For Predefined panels, Conjointly’s fieldwork team manually hand checks each response to ensure you receive high-quality data.
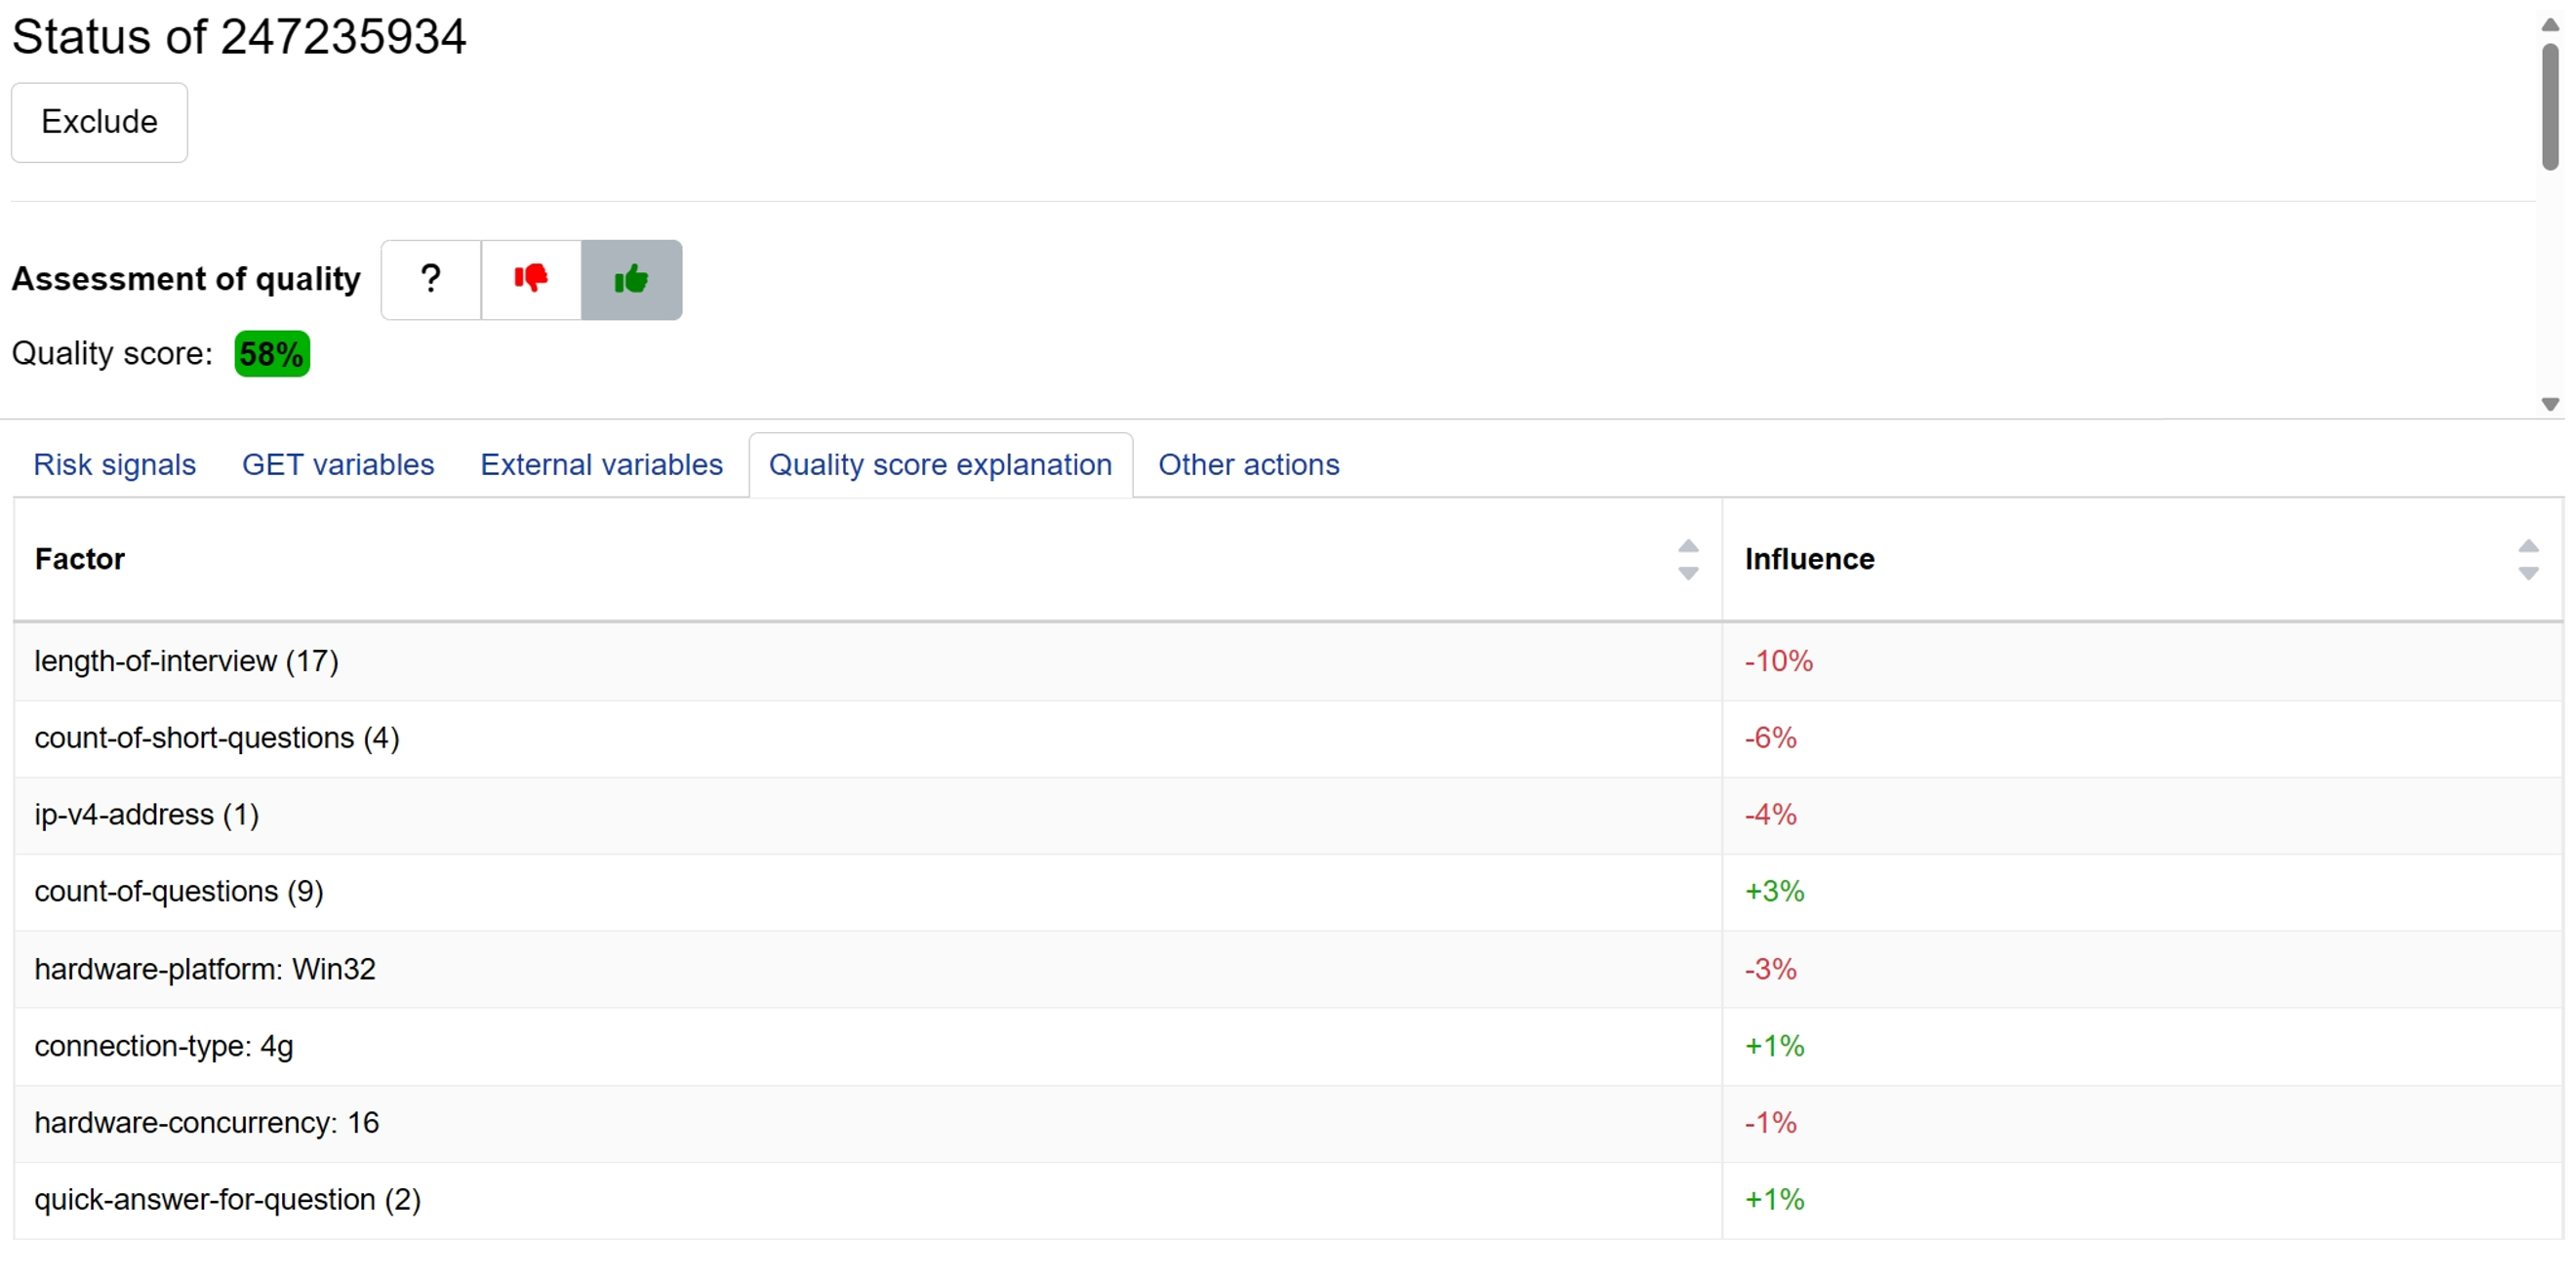
Beyond these quality assurance processes, Conjointly provides the Quality Check dashboard, allowing you to review responses and choose which to include in your analysis based on your specific research needs. Within the dashboard, you can find an automated Quality score (QS) assigned to each respondent which helps predict respondent quality based on risk signals. The Quality Score explanation tab shows the top contributing factors behind each score.
These tools work together to help you evaluate responses quickly and reduce time spent on inclusion decisions while offering several advantages:
- Identify potential quality issues without reviewing individual responses.
- Get a single, comprehensive quality measure covering fingerprints, hardware, survey behaviours, open-ended responses and more.
- Apply consistent evaluation without personal subjectivity in quality assessment.
- Include or exclude responses based on your own quality thresholds and project needs.

How does Quality score works?
Conjointly’s Quality score combines machine learning with fieldwork team expertise. The system learns from historical respondent data to automatically predict the quality of new survey participants based on their risk signals.
The system generates percentage-based scores to provide you intuitive guidance for decision-making:
- Above 50% (Highlighted in green): High-confidence responses with strong quality indicators.
- 26-50% (Highlighted in orange): Responses with mixed signals requiring your review.
- 25% or below (Highlighted in red): Responses with multiple risk factors detected. Review recommended before inclusion.
You can identify the most influential factors contributing to each score through the Quality Score explanation tab.
The machine learning system continuously evolves as it processes more survey data and incorporates ongoing fieldwork team insights. Each new respondent interaction and quality assessment refines the model’s ability to detect subtle patterns and emerging fraud tactics. This means the system becomes increasingly accurate over time, adapting to changes in respondent behaviour and new survey methodologies without requiring manual updates. As the system evolves, please note that the baseline score and quality thresholds may also be adjusted to maintain optimal accuracy.
What influences Quality score?
Quality score starts from a baseline and adjusts based on detected risk signals, some factors increase the score while others decrease it. Both the signals and their impact continuously evolve as the system learns from new data.
The main categories of risk signals include:
- Survey quality indicator assess how respondents interact with questions, including scrolling behaviour, response timing, and engagement levels.
- Device and network information examines hardware specifications, browser characteristics, IP addresses, and connection methods.
- Behavioural patterns track actions like tab switching, copy-pasting text, using developer tools, and translation services.
- Time and duration assessments monitor interview length, question response speed, and pacing patterns.
- Geographic and location signals verify location consistency across different detection methods and time zone accuracy.
- Response consistency identifies duplicate participants through various detection methods.
- Open-ended analysis evaluates text quality, detects nonsensical responses, and identifies copied content.
- Experiment metadata captures survey characteristics like question counts, experiment type, and design features.
- Quality settings reflect the configured detection parameters for your specific survey setup.
- Digital fingerprinting uses advanced detection for bots, virtual machines, VPN usage, and browser modifications.
The system processes hundreds of individual risk signals across these categories. The Quality Score explanation displays only the most influential factors to keep information manageable and actionable. The tab shows the top contributing factors using easy-to-understand labels, helping you make informed inclusion decisions.
You should pay particular attention to factors associated with survey rushing, straightlining patterns, or poor open-ended responses, as these often indicate inattentive participants who may compromise your data quality.
For high-quality responses, you’ll typically see only experiment metadata factors (question counts, survey type) in the explanation tab. These metadata signals shouldn’t concern you, as they’re simply characteristics of your survey design rather than quality issues.
FAQs
How does the Quality Score algorithm work technically?
Quality Score uses a Random Forest machine learning algorithm that creates hundreds of decision trees, each trained on different subsets of historical respondent data. When scoring a new participant, each tree votes on quality probability, and the final percentage score represents the average of these votes. The system uses SHAP (SHapley Additive exPlanations) analysis to identify which factors contributed most to each score, ensuring the top contributing factors shown in the explanation tab are mathematically determined rather than arbitrary selections.
Why can’t I see all the risk factors that influenced my score?
The explanation tab displays only the most impactful factors to avoid information overload. While the system analyses hundreds of data points, showing only the top contributors helps you focus on the most relevant quality indicators for decision-making.
Should I exclude all responses below 50%?
Not necessarily. These responses may be acceptable depending on your quality standards and project requirements, review the explanation factors for more information.
What do the numbers and symbols in the explanation tab mean?
The explanation tab shows factor labels with additional details:
- Numbers in brackets like “(23)” indicate how many times something occurred (e.g., 23 instances of short answers).
- Colons like “browser-language: en-GB” show specific values.
- Some factors appear as ranges like “keypressdeviation_25” indicating the respondent falls within a certain behaviour range
The system groups similar factors together and counts occurrences to give you a clearer picture of response patterns without overwhelming technical detail.
Why does the same factor show different scores for different respondents?
Rather than applying fixed weights or rule-based scoring, the Quality score weights factors differently based on the complete response pattern. The same factor might signal higher risk when combined with certain other behaviours, so identical factors can receive different scores depending on each respondent’s unique profile.