Pre-built Data Stories
Pre-built Data Stories are ready-made analysis templates built by the Conjointly team for common question types and data checks, ranging from ranking, multiple choice, and Likert-scale questions to conjoint choice patterns, fieldwork, and sample quality.
Some stories are added to your report automatically based on your survey’s questions and set-up. You can add others at any time, and if a story does not apply to your report, the platform tells you why. In stories that compare segments, you can use the dropdown to choose which segments to include.
You can use any story as it is or edit its content, formatting, and calculations to fit your research goals.
Explore each pre-built Data Story below to see when it is added automatically or ready for you to add, and what it covers.
Ranking questions
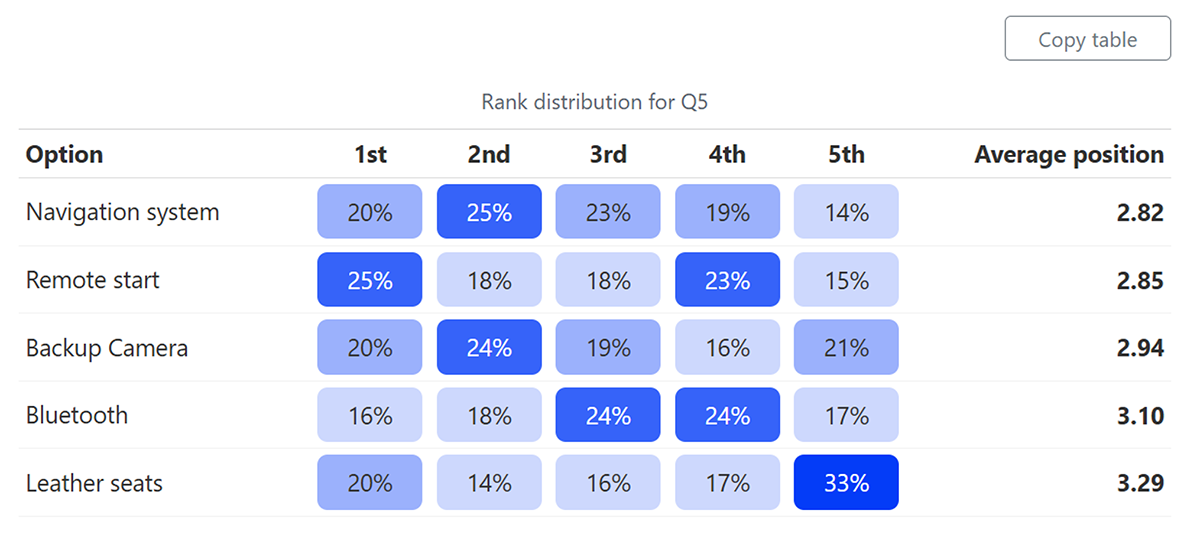
You can add this story when your report includes a ranking question. It shows the share of respondents who placed each option at each position, with options sorted by average position.
Ranking by segment
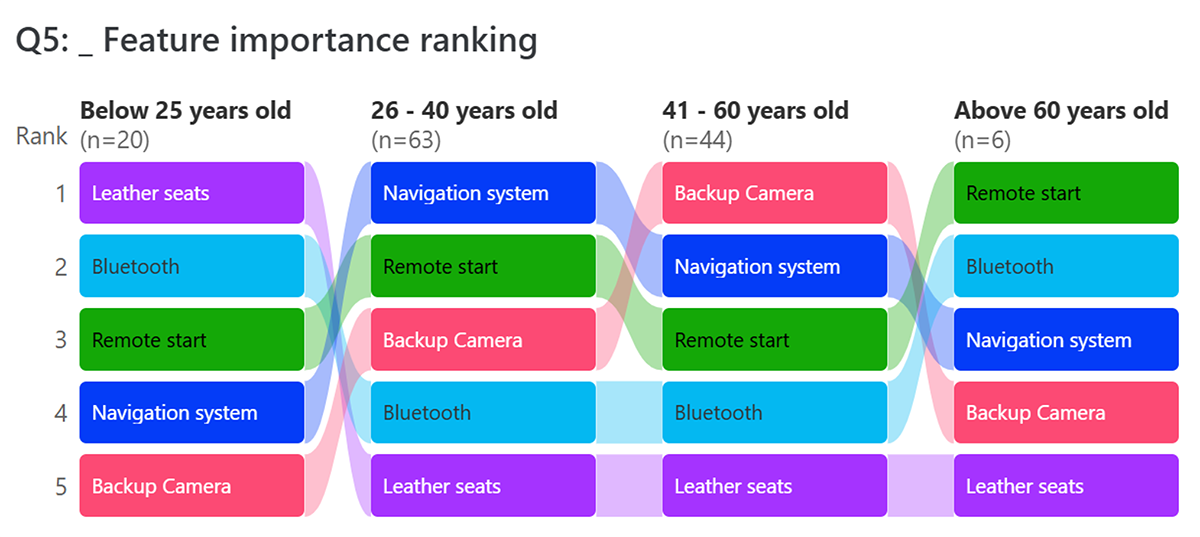
You can add this story when your report has a ranking question and at least one segment. It shows how options rank in each selected segment, so you can compare priorities between them.
Multiple choice by segment (bar chart)
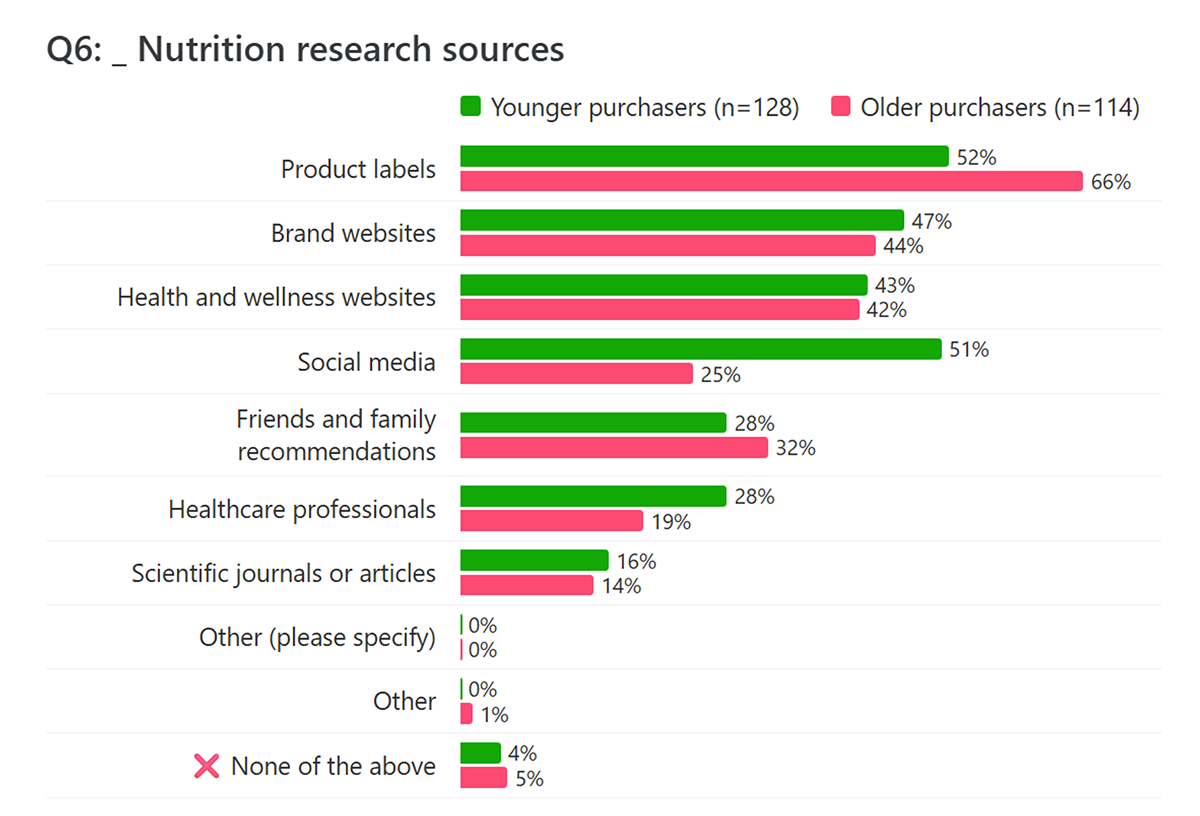
You can add this story when your report has a multiple choice or dropdown menu question and at least one segment. It shows the distribution of responses to each question across selected segments, in one combined chart or separate charts.
Multiple choice by segment (dot plot)
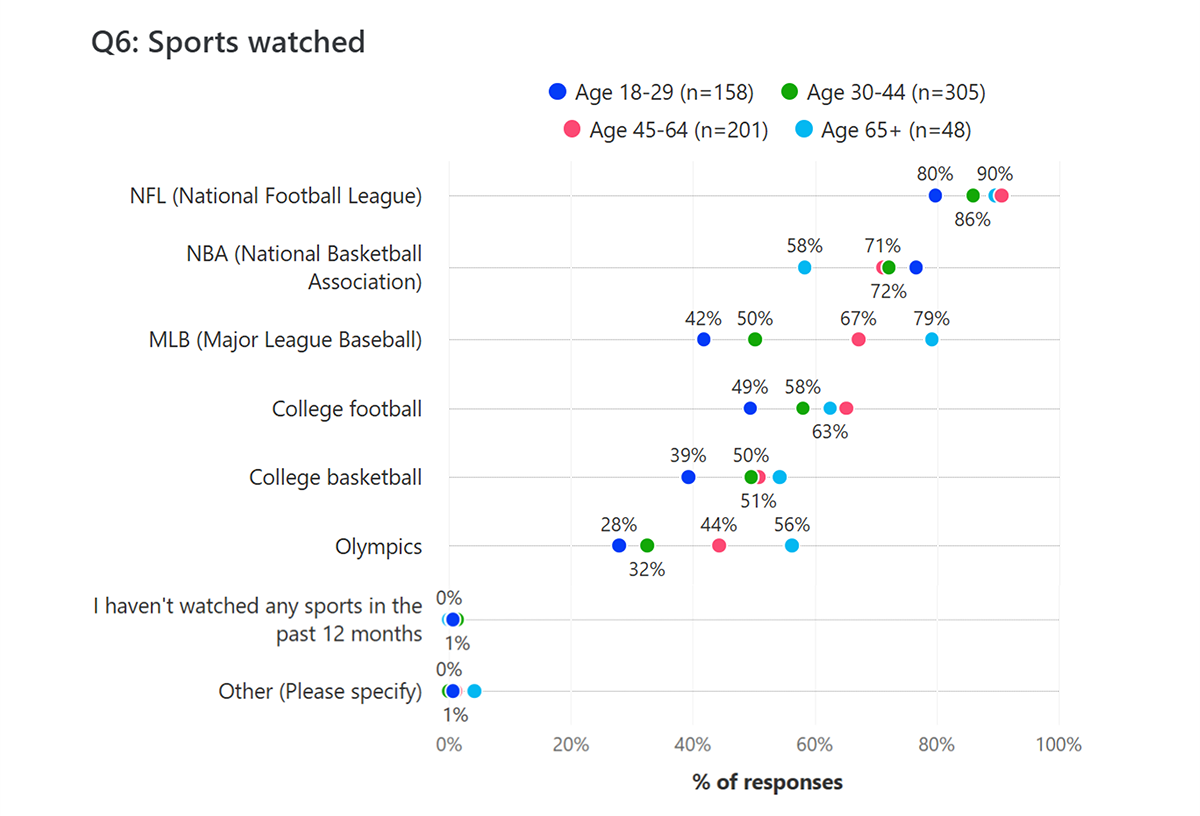
You can also add this story to show the distribution of responses across selected segments in a dot plot. Each option gets its own line, with a coloured dot for each segment, so the gaps between them are easy to spot at a glance.
Likert-scale answers
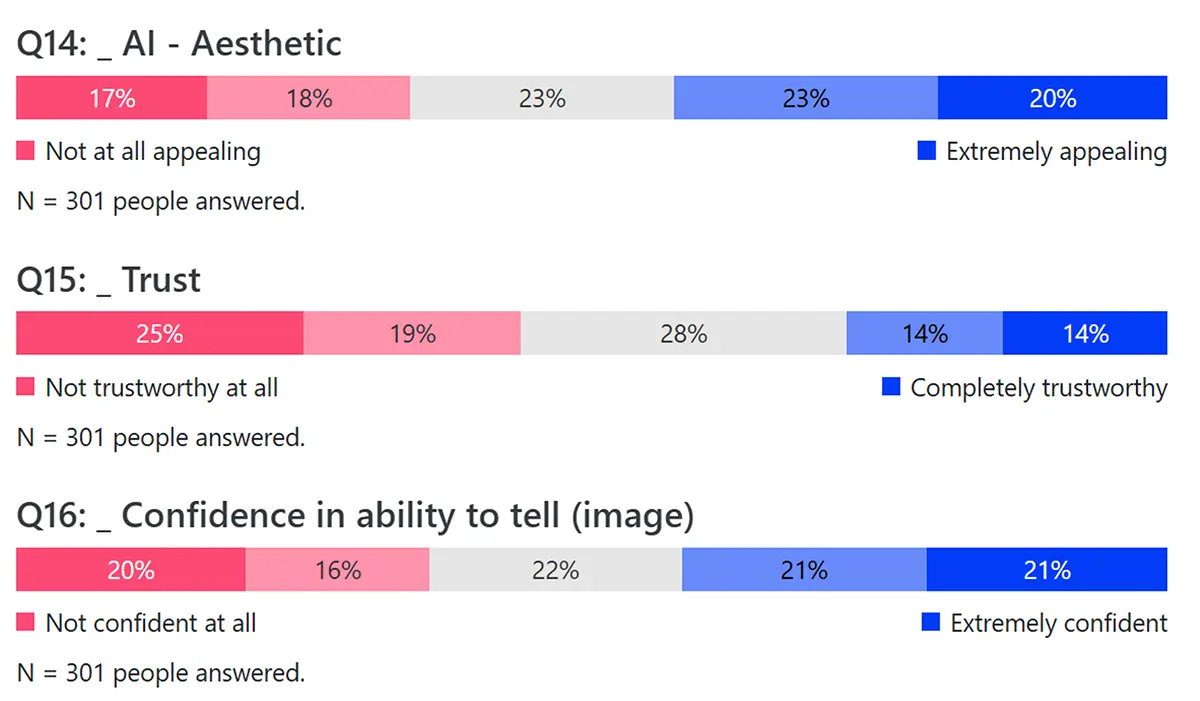
You can add this story when your report has a Likert-scale question. It shows the distribution of responses to each question across the scale points.
Likert-scale answers by segment
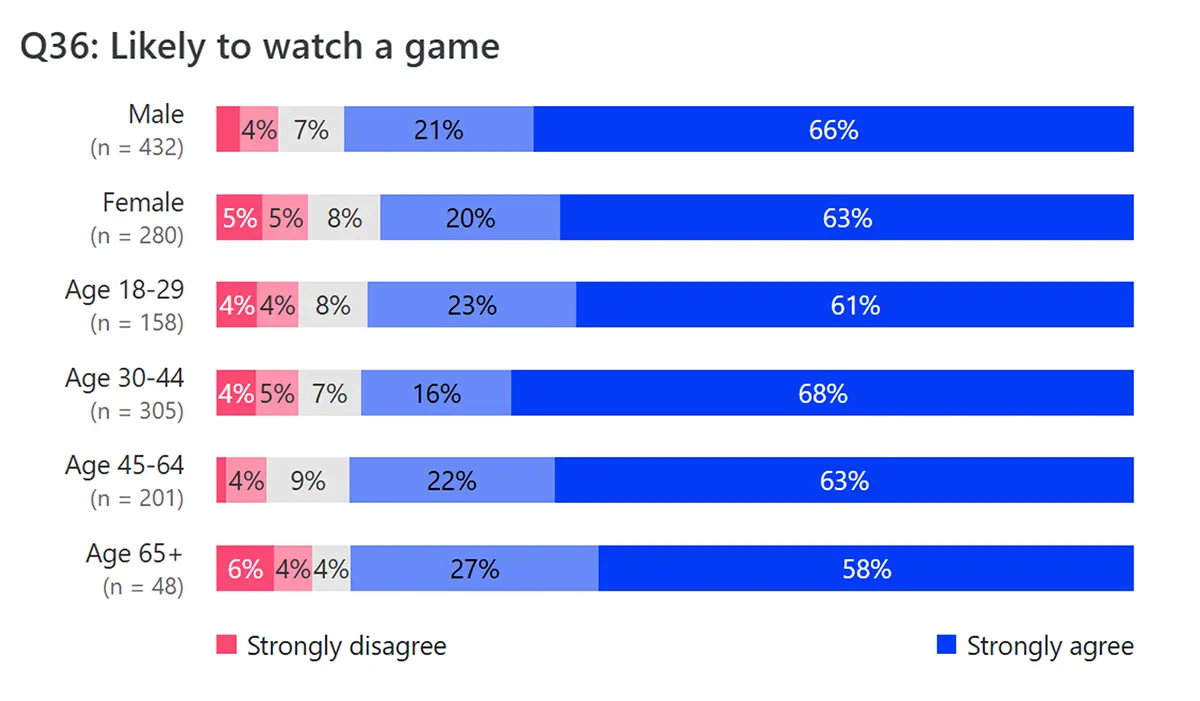
You can add this story when your report has a Likert-scale question and at least one segment. It shows the distribution of responses across selected segments.
NPS by segment
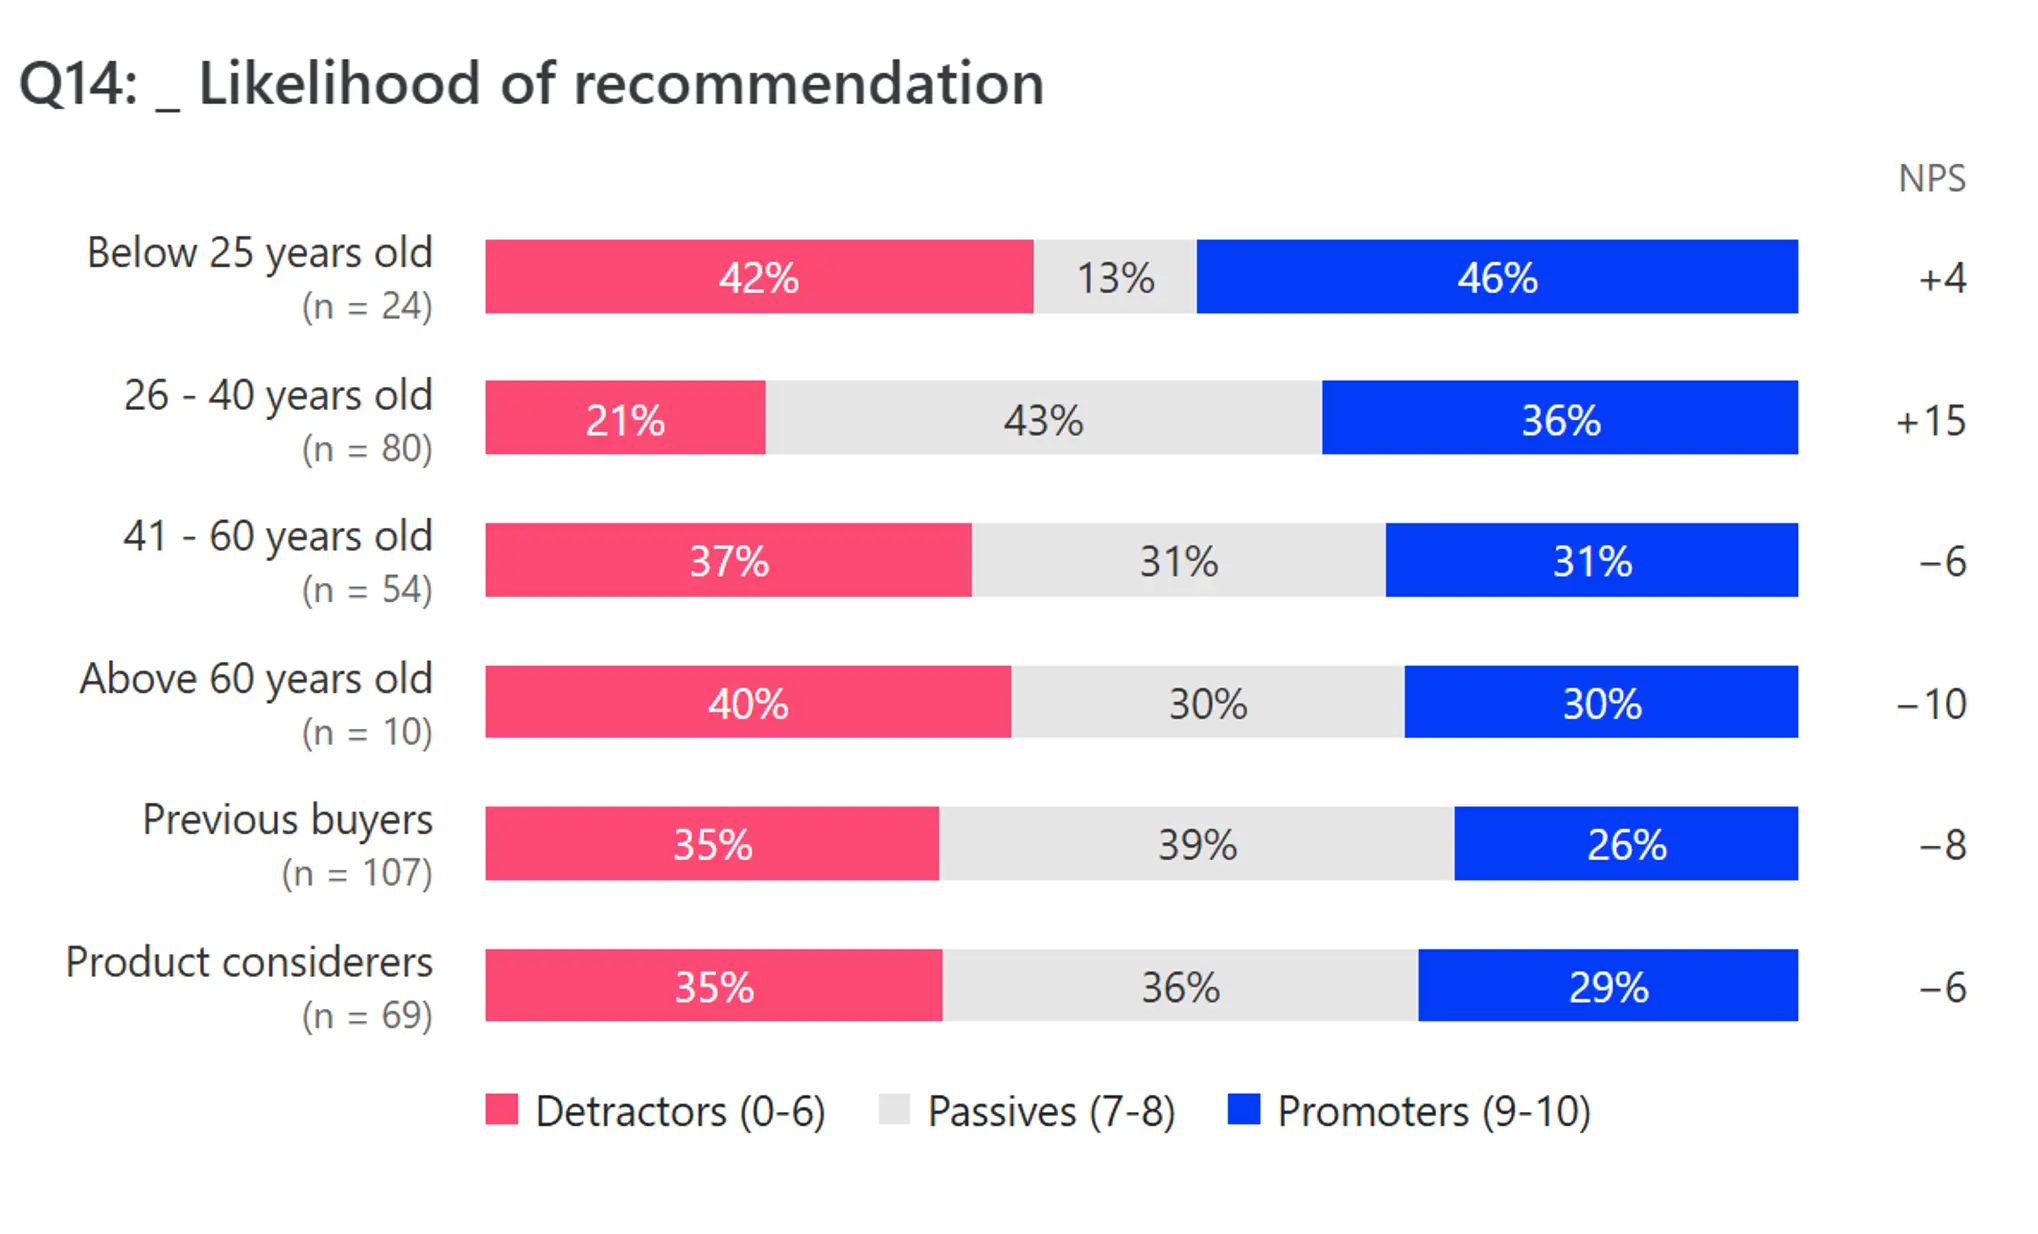
You can add this story when your report has an NPS question and at least one segment. It shows each segment’s NPS alongside its split of Detractors, Passives, and Promoters, so you can trace where each score comes from.
Implicit test
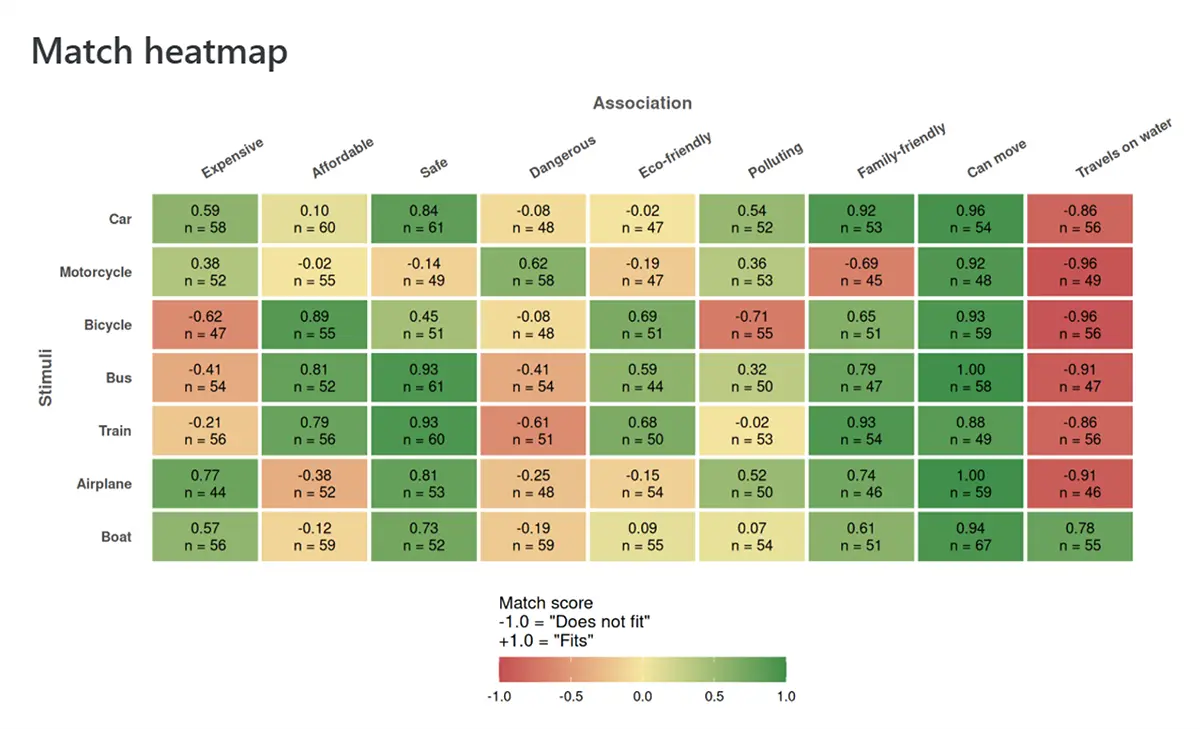
This story is added automatically for each implicit test block in your report. It checks responses for speed and attention, scores how well each pairing fits, highlights the associations respondents made fastest, and summarises the results.
Segment overview
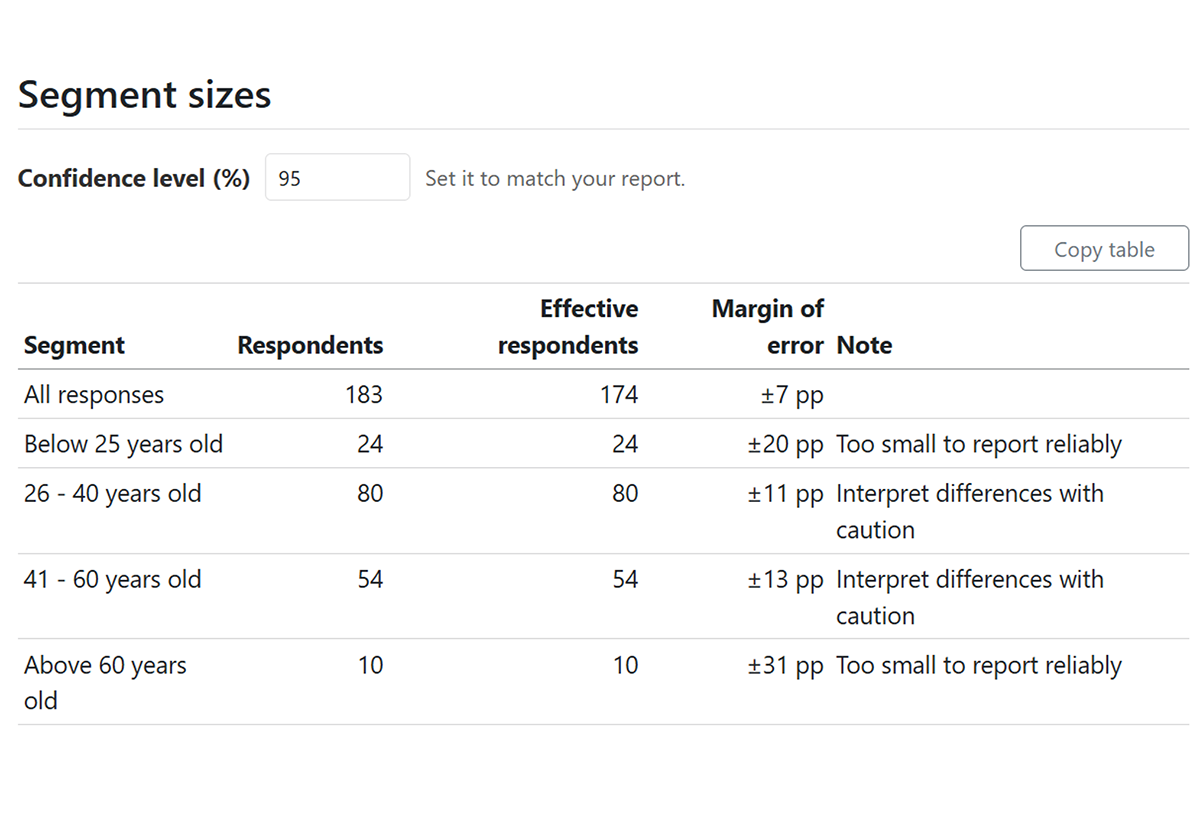
You can add this story when your report has at least one segment. It lists each segment’s size and margin of error, flags segments that are too small for reliable results, and compares the selected segment with the rest of your respondents.
Sample composition
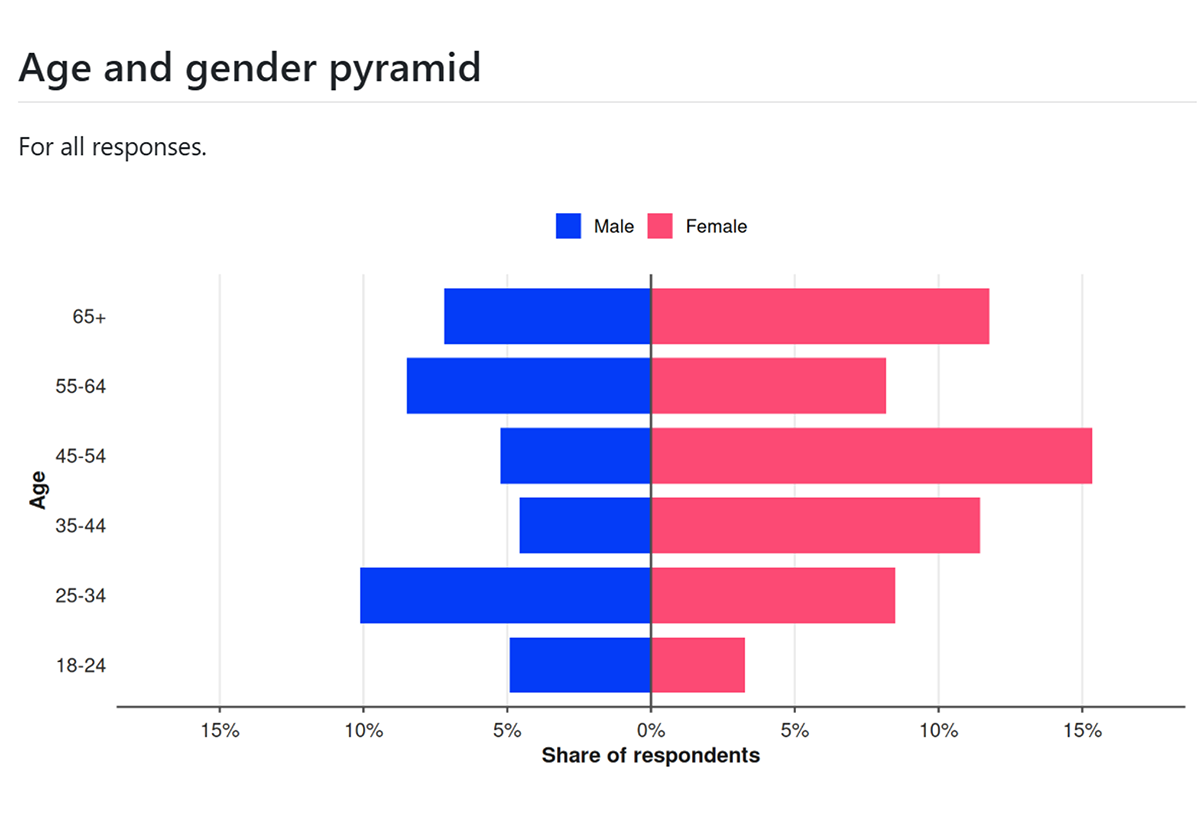
This story is added automatically when your report includes a gender and age question. It compares the age and gender split of each segment with all responses, and shows the same split as a pyramid for the selected segment.
Weighting efficiency
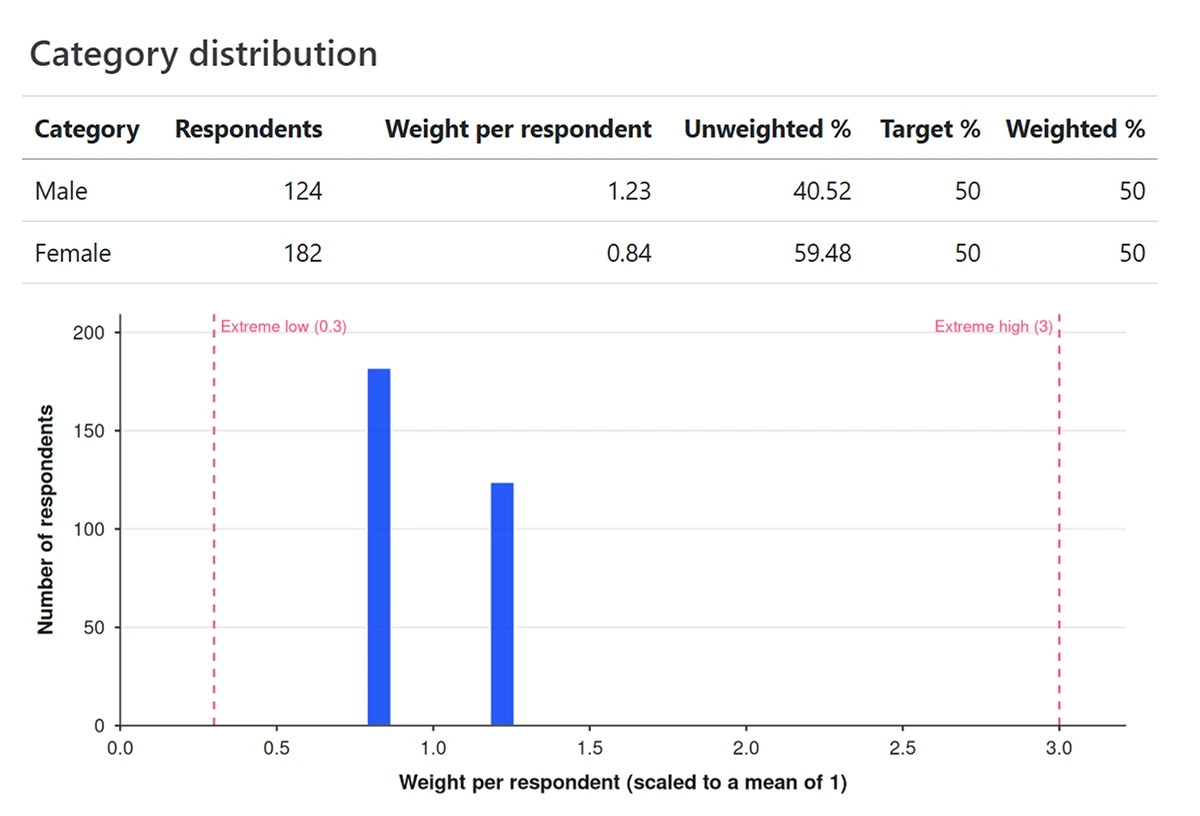
This story is added automatically when your report uses a weighting scheme. It shows how efficient your weighting is for the selected segment, with a weight efficiency score and short verdict for each scheme, a breakdown of its weights, and flags for any extreme weights.
Conjoint choice patterns
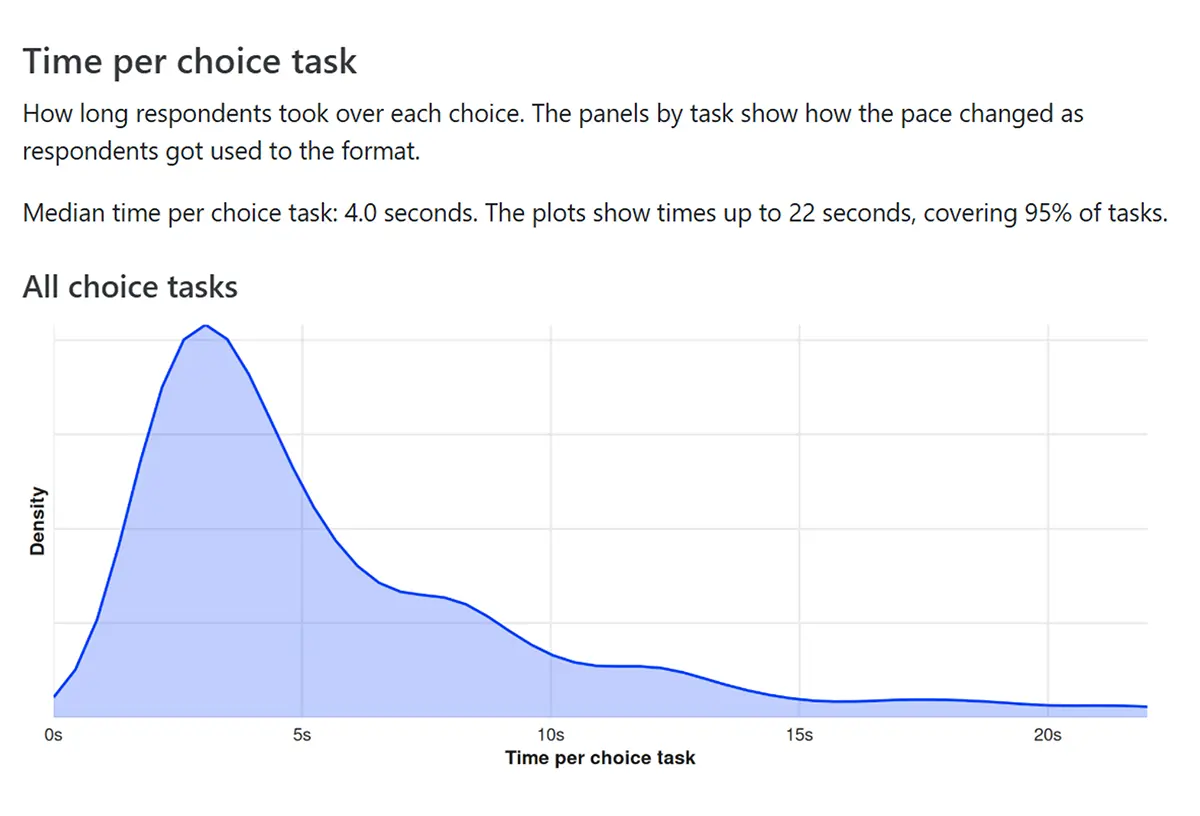
This story is added automatically when your report includes a conjoint, MaxDiff, Claims Test, or Product Variant Selector question. It checks for choice shortcuts, such as always picking the option in the same position or deciding on one attribute alone, and shows how long respondents spent on each choice task.
Response timeline
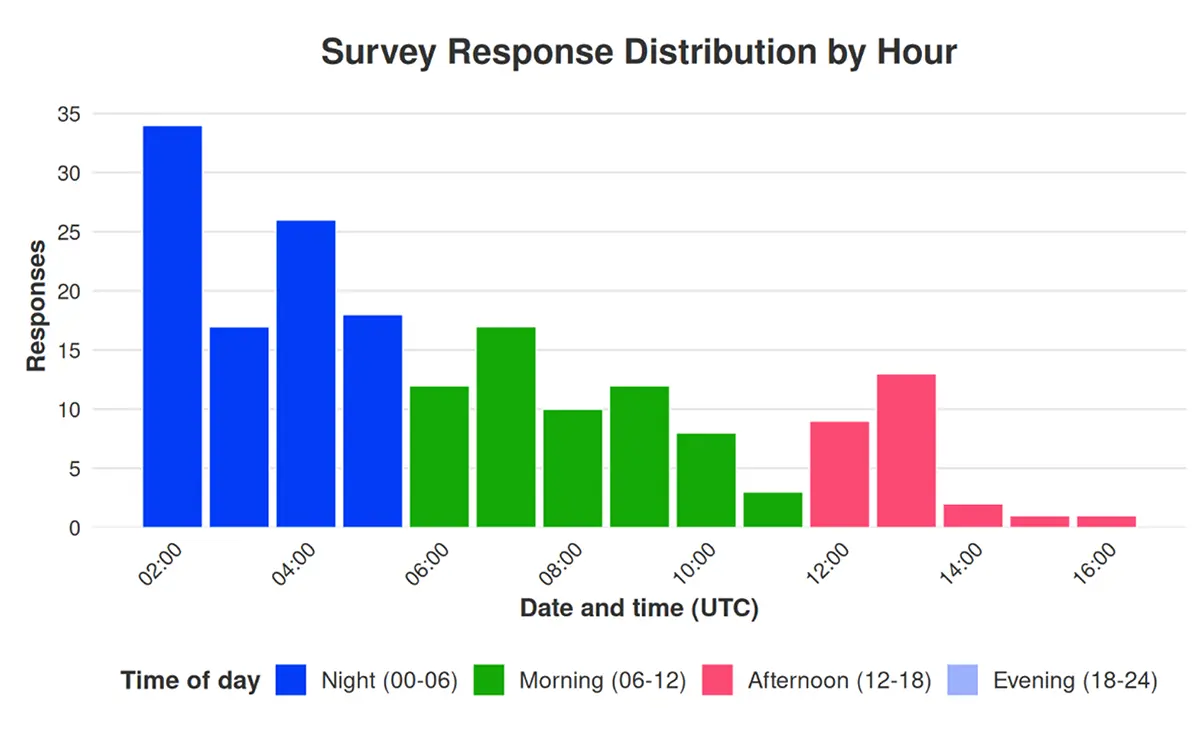
This story is added automatically to every report. It charts when your responses came in, by date and by time of day, and summarises your fieldwork: how long it ran, the busiest periods, and how many responses came from each participant source.
Response counts
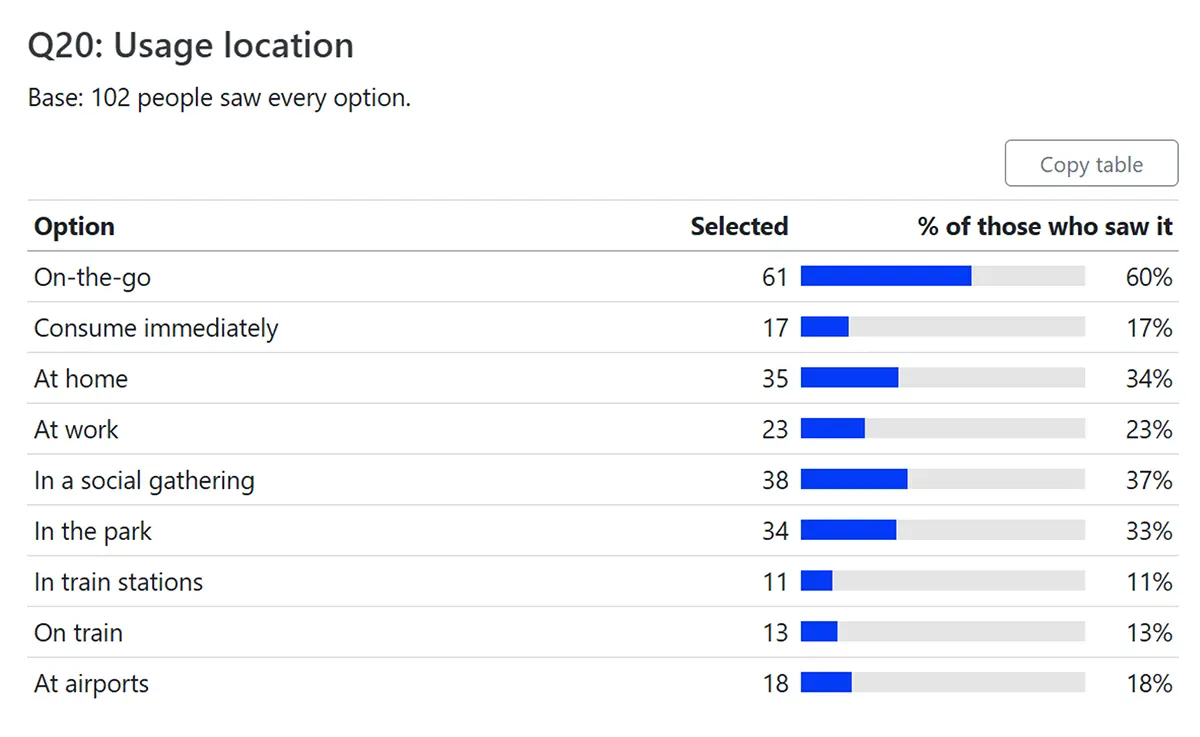
This story is added automatically when your report includes a multiple choice or dropdown menu question. It shows a table for each question, with the number and share of respondents who selected each option, out of those who saw the question.
Related guides
- How to use Data Stories in your report for finding, reading, managing, and editing stories.
- Segmentation for subgroup analysis for setting up segments to compare in Data Stories.