Viewing available variables for analysis
Insights Explorer provides a Variable viewer tab that displays all available variables in your current session and their properties. This tab updates automatically after file uploads and R code execution, helping you track what variables you can use in your analysis.

What information is displayed
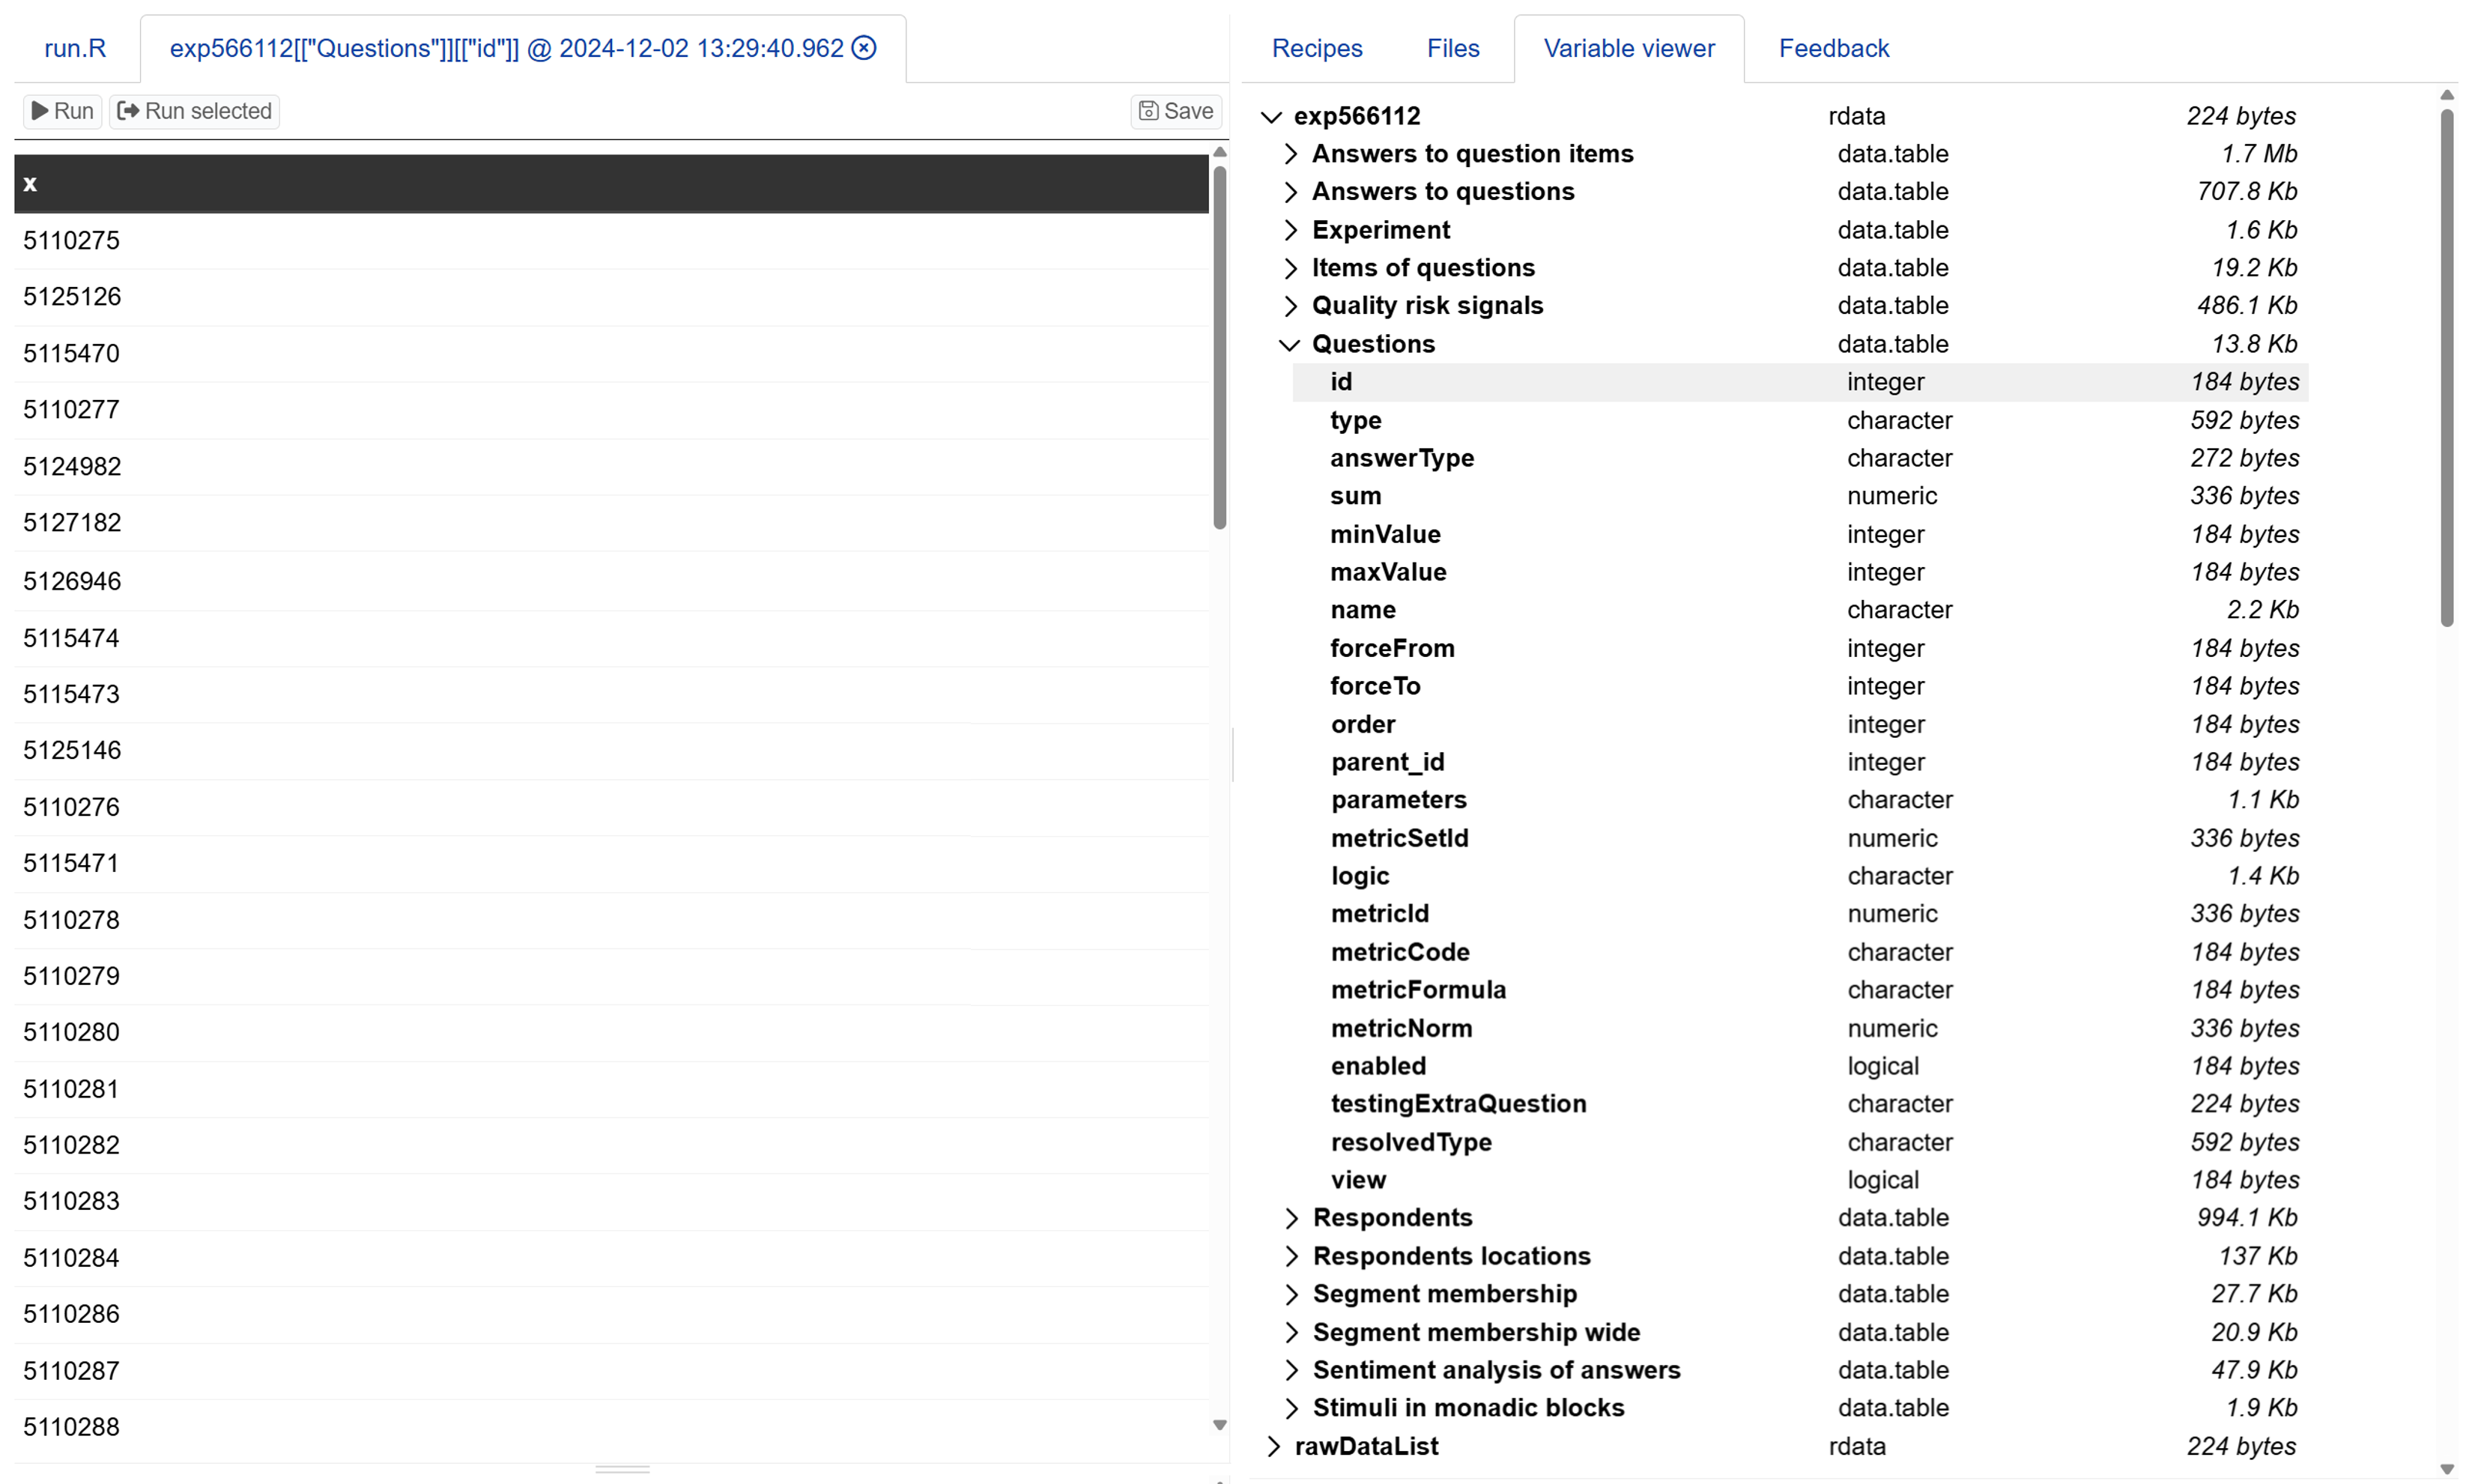
When you load experiment data, the Insights Explorer organises it in a nested table structure that mirrors your exported R file hierarchy. Each table can be expanded to show its contents.
Main data tables show your data worksheets, such as Questions, Stimuli in monadic block, Answers to questions. These work sheets appear as “data.table” type with their memory size shown. You can expand each worksheet to see its variables, with each row showing the variable name, data type, and memory size.
Clicking a variable shows its detailed information in the R code editor, helping you understand its content for use in code or analysis.

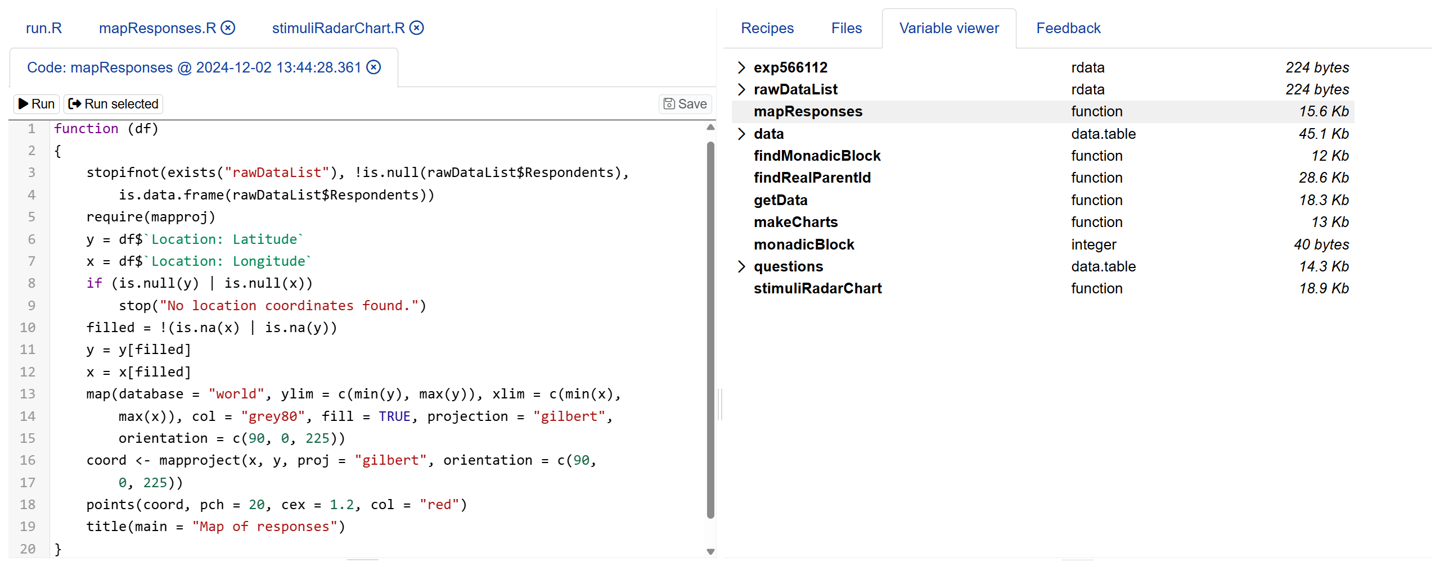
The viewer also shows analysis functions marked as “function” type, including executed Recipes and operations like mapResponses and makeCharts.

When variables update
The Variable viewer refreshes automatically to show current variables in your session. Updates occur when you:
- Load experiment data into Insights Explorer.
- Execute Recipes for analysis.
- Run R code in the editor.
- Enter commands in the console.
How to use variables in analysis
The Variable viewer helps you write accurate R code by showing available variables and their properties. Here’s how to use this information in your analysis:
- Expand nested data tables to see their variables.
- Click variables to see their detailed content in the code editor.
- Use the exact variable names in your code.
- Check data types (numeric, character, integer, etc.) to ensure correct operations.
You can also use the viewer to verify if your required variables are available when using Recipes or writing your own R code.
Next steps
You can also read about: