Exploring insights with recipes
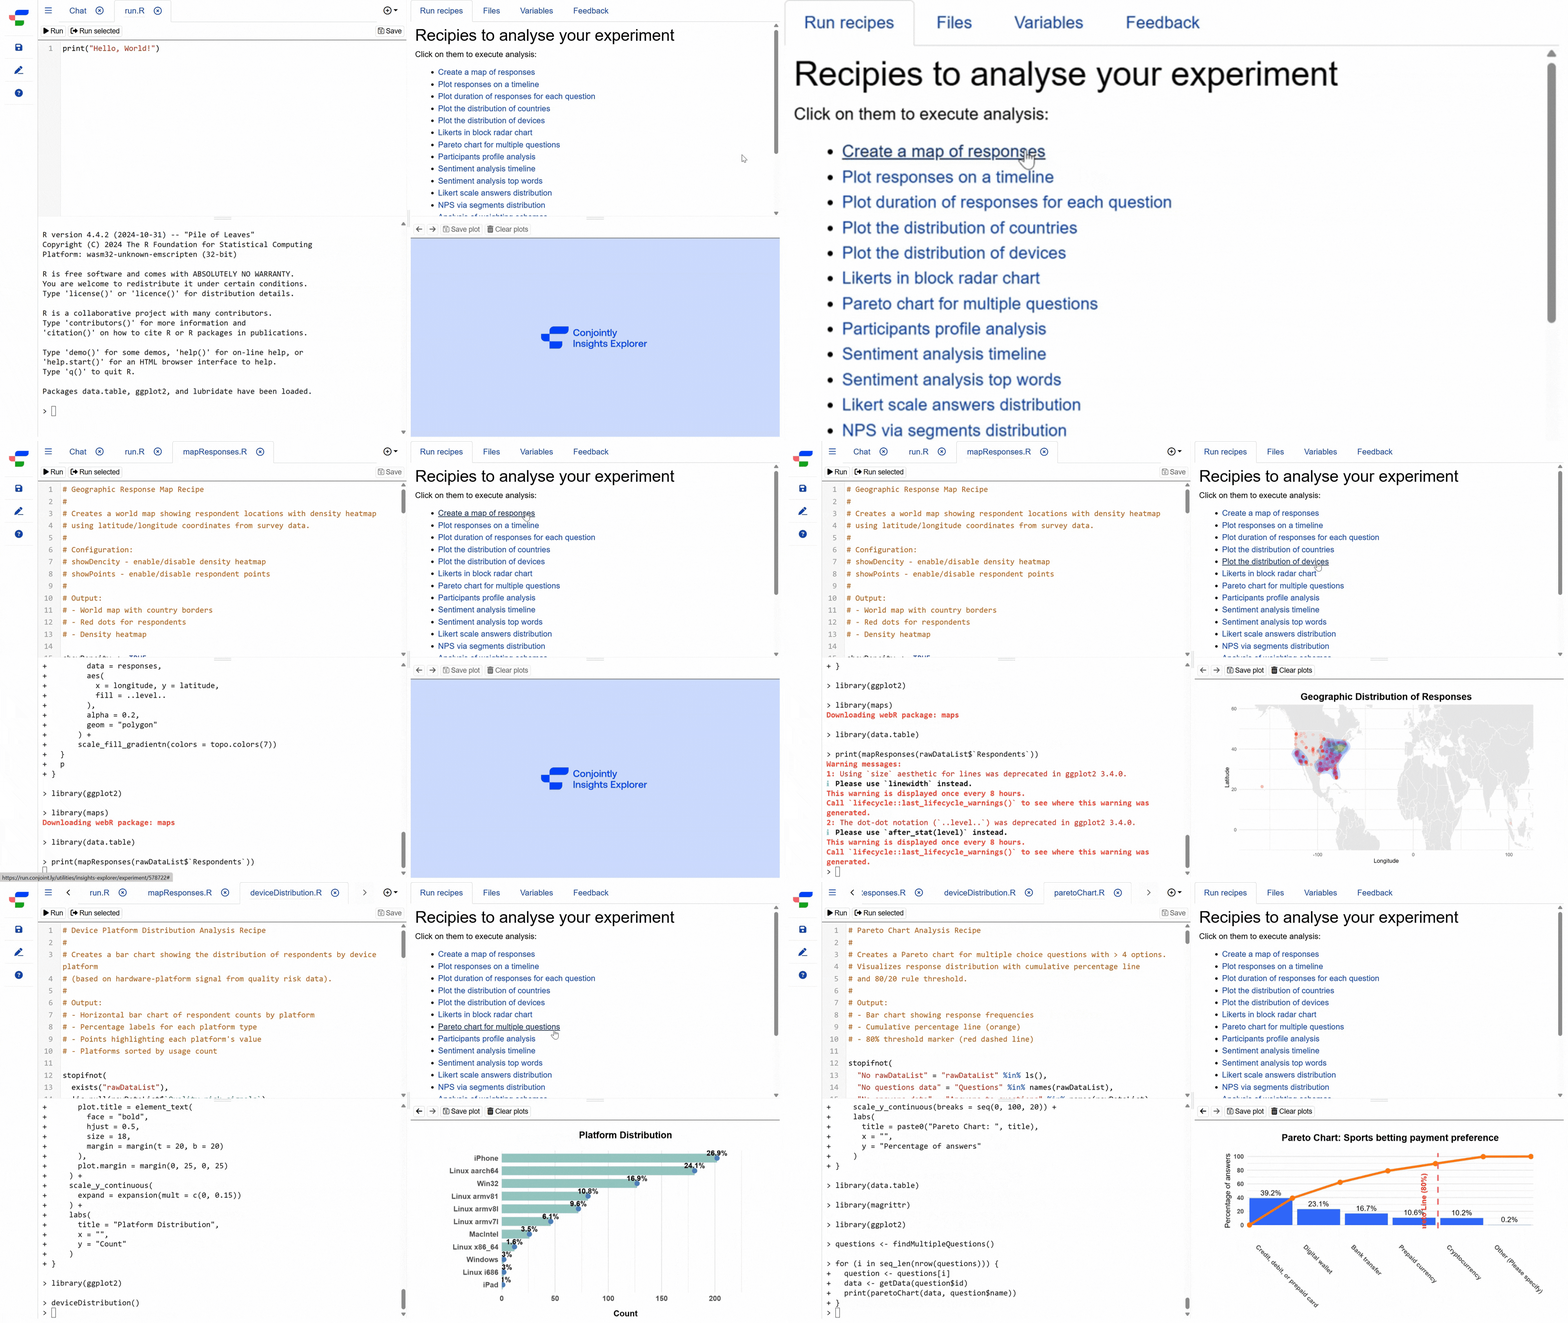
Available Recipes
The Insights Explorer’s tab provides ready-to-use R scripts organised into categories:
- Descriptive analysis of the sample
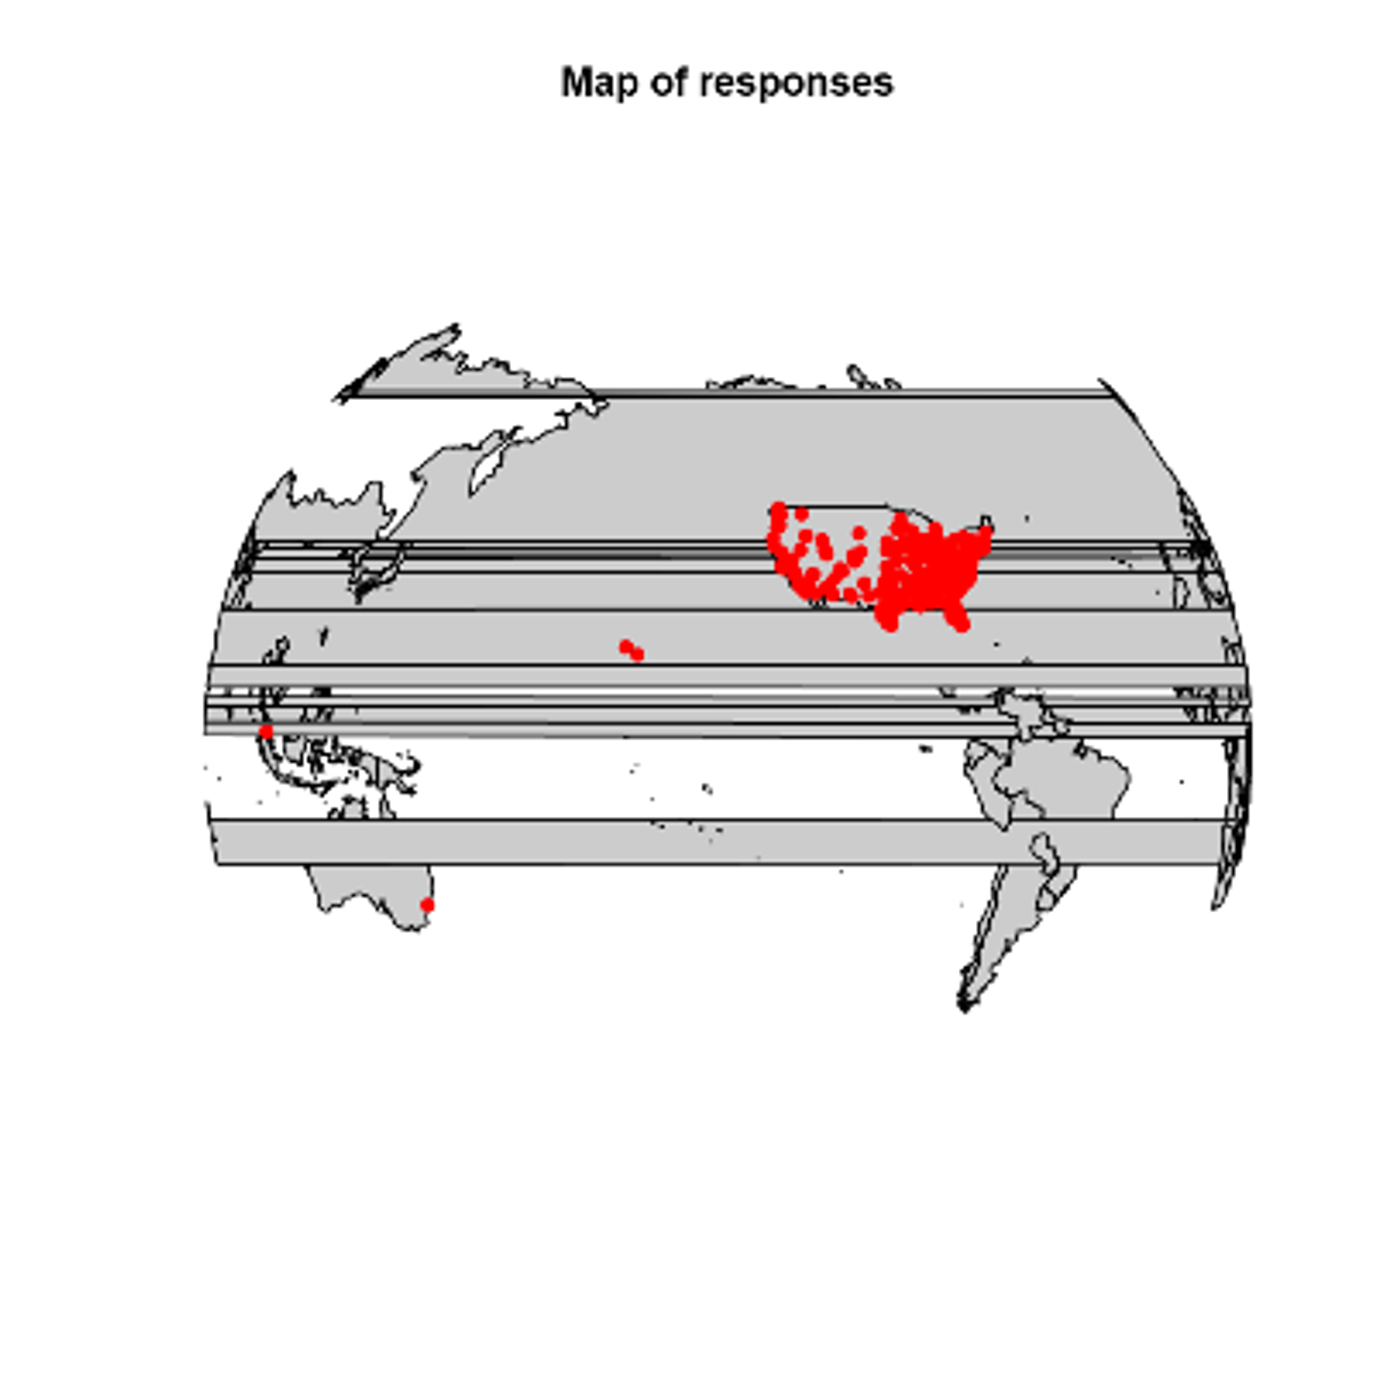
- Create a map of responses
- Plot responses on a timeline
- Plot duration of responses for each question
- Plot duration of responses for individual respondent
- Plot the distribution of countries
- Plot the distribution of devices
- Participants profile analysis
- Analysis of weighting schemas
- Specialised analysis
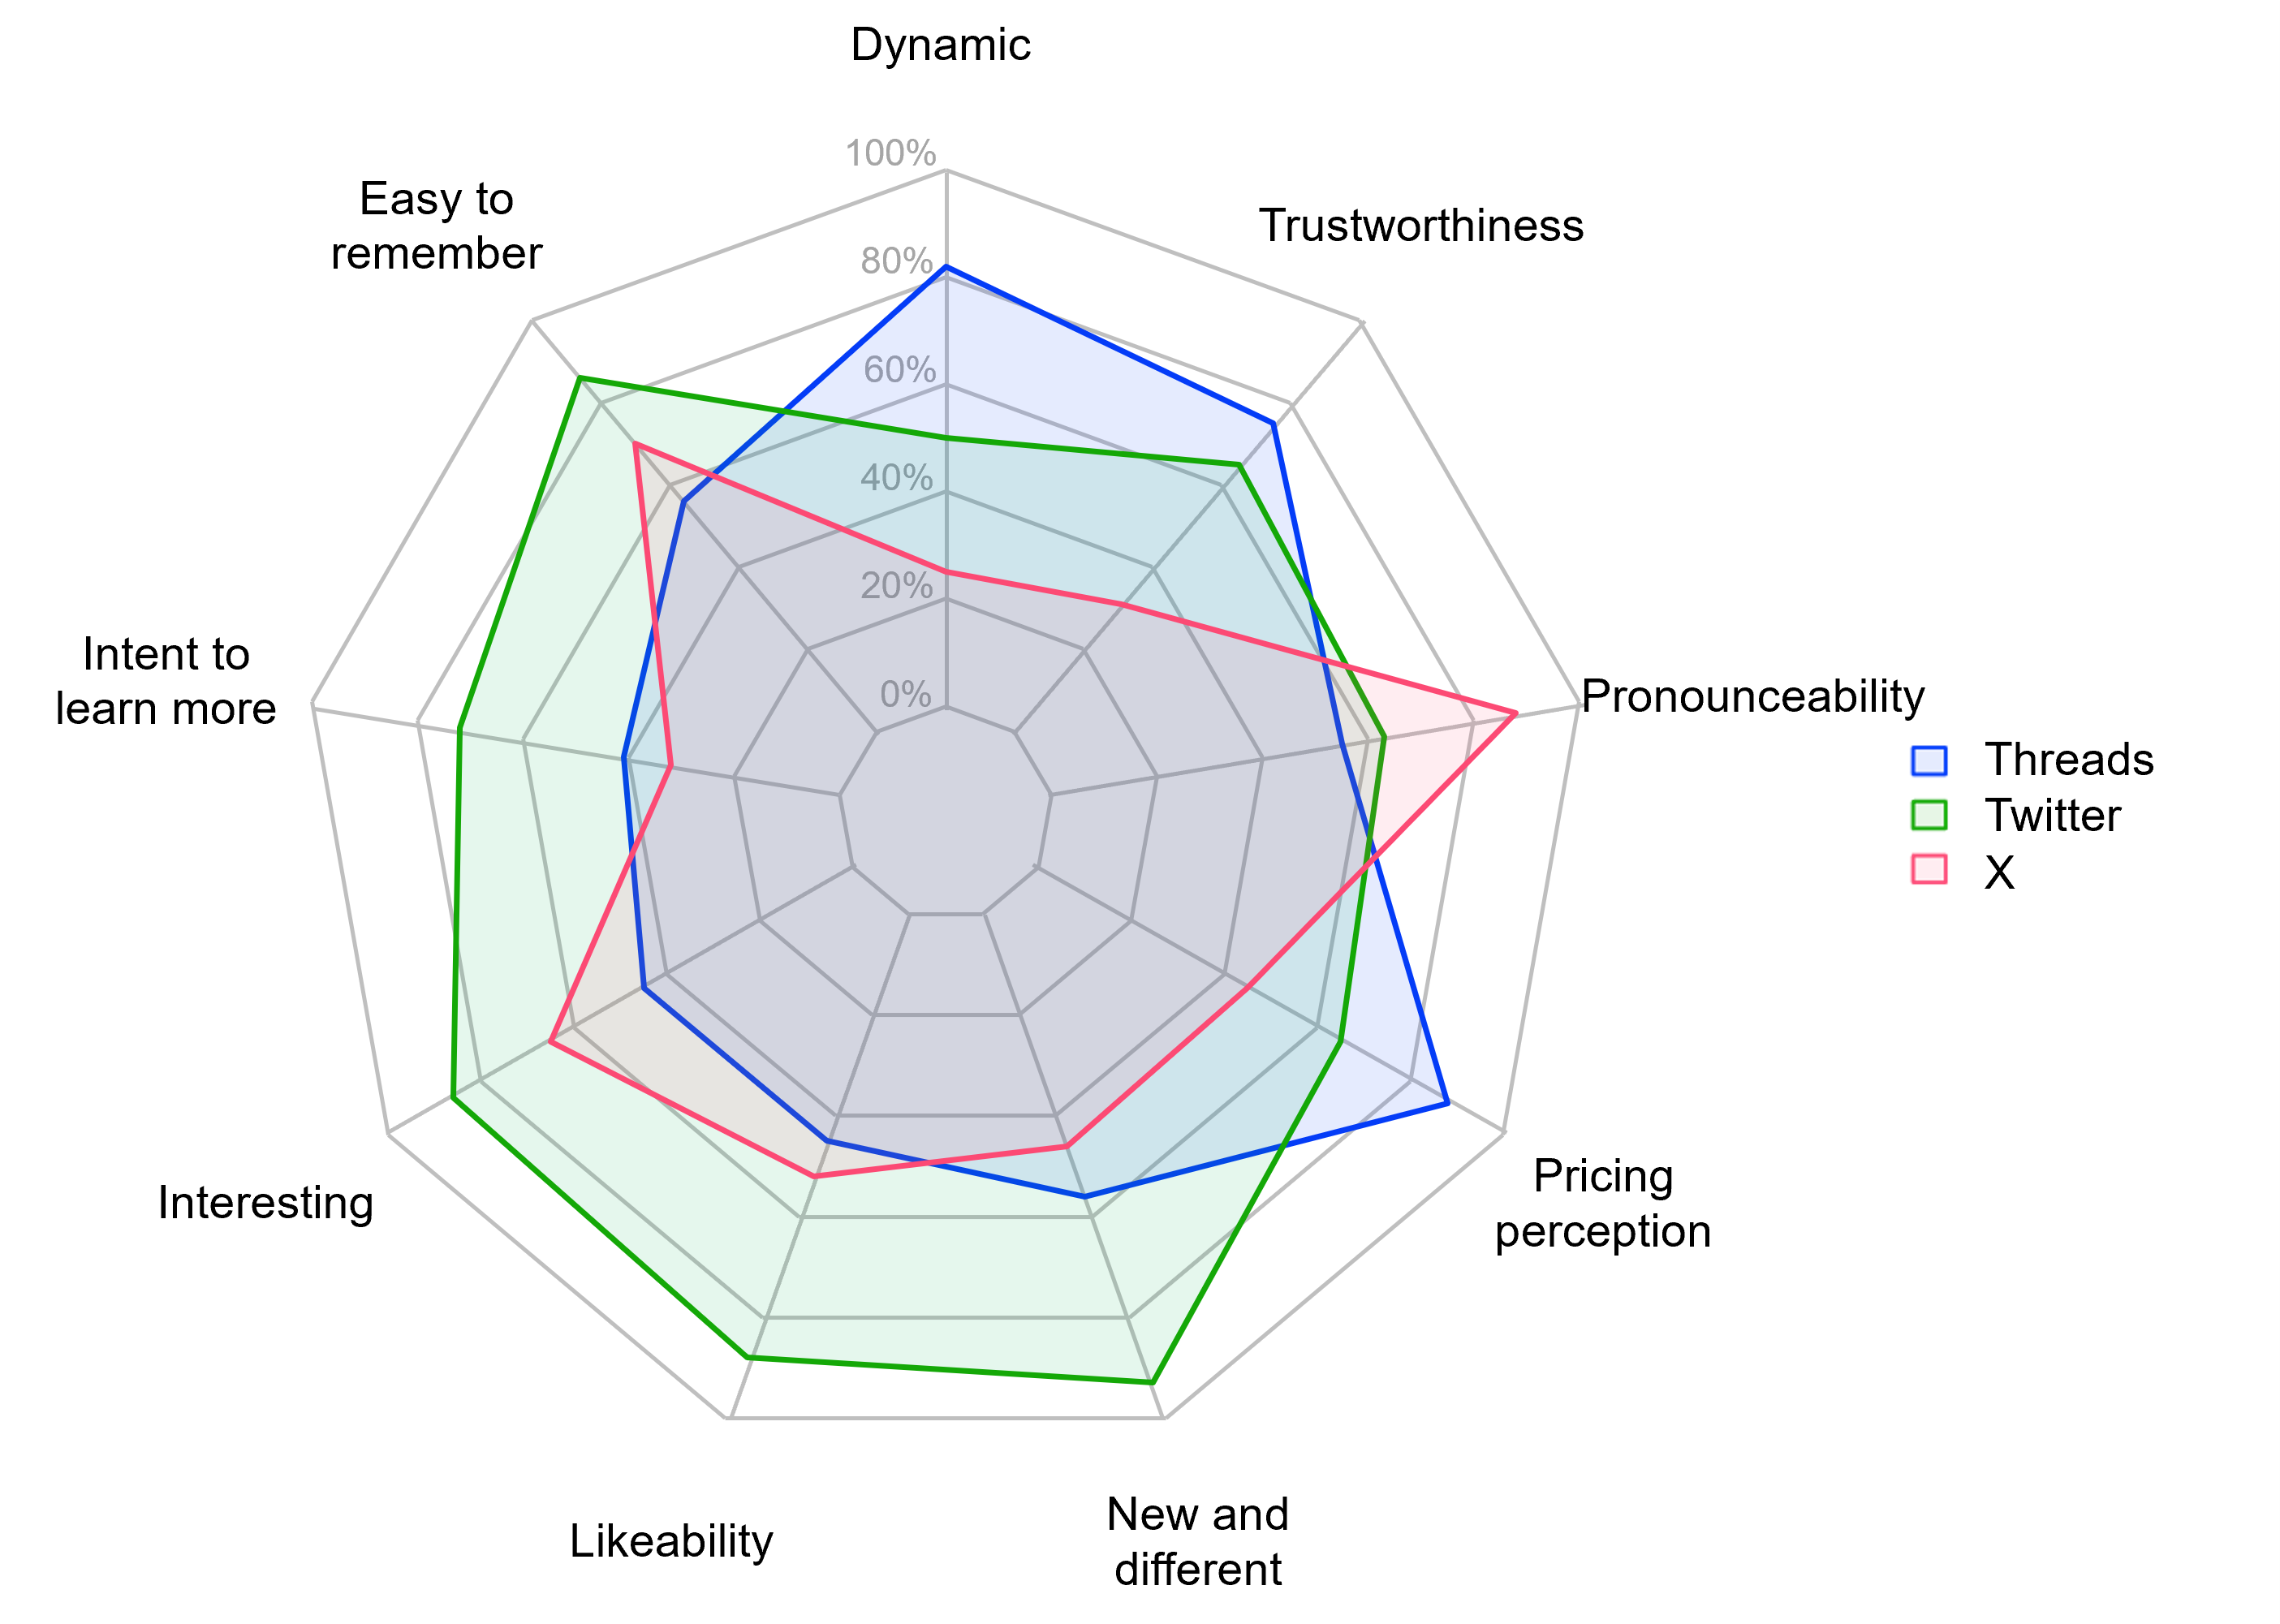
- Likerts in block radar chart
- Pareto chart for multiple choice questions
- Sentiment analysis timeline
- Sentiment analysis top words
- Likert scale answers distribution
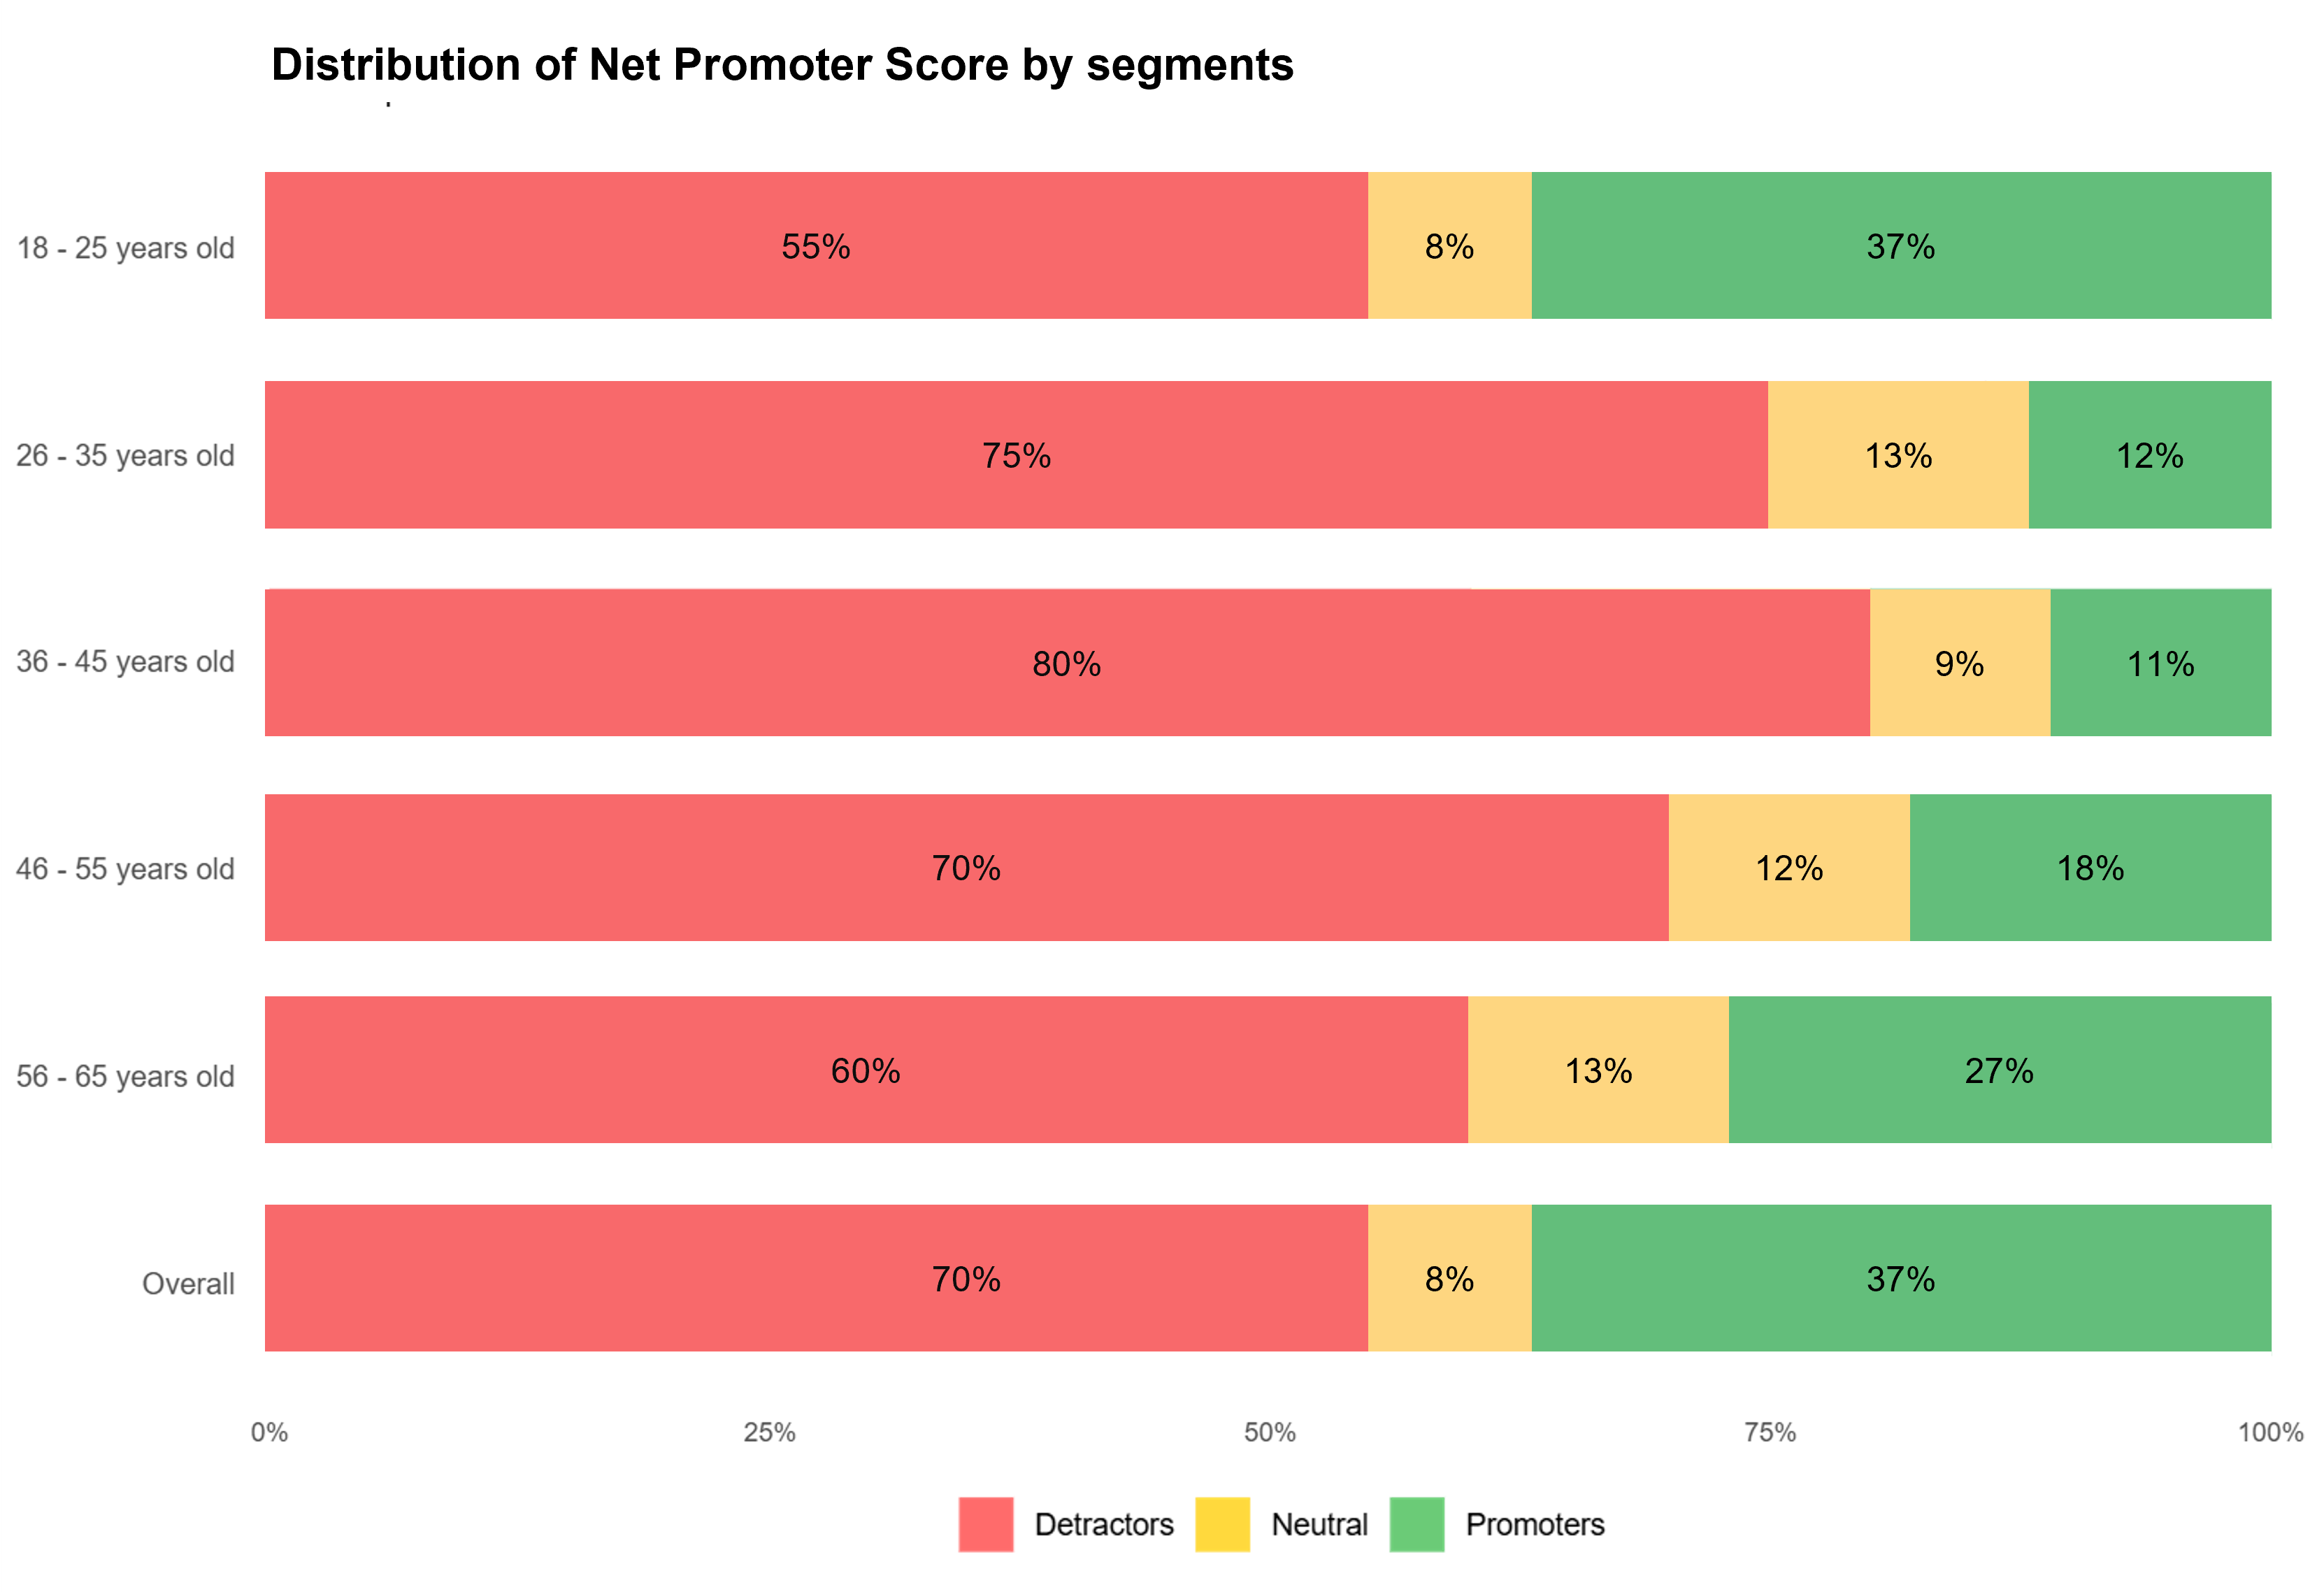
- Net Promoter Score via segments distribution
- Other recipes
- Special recipes for Claims Tests and Product Variant Selectors
- Special recipes for conjoint analysis
- Custom cross-tabs
- Fun R scripts
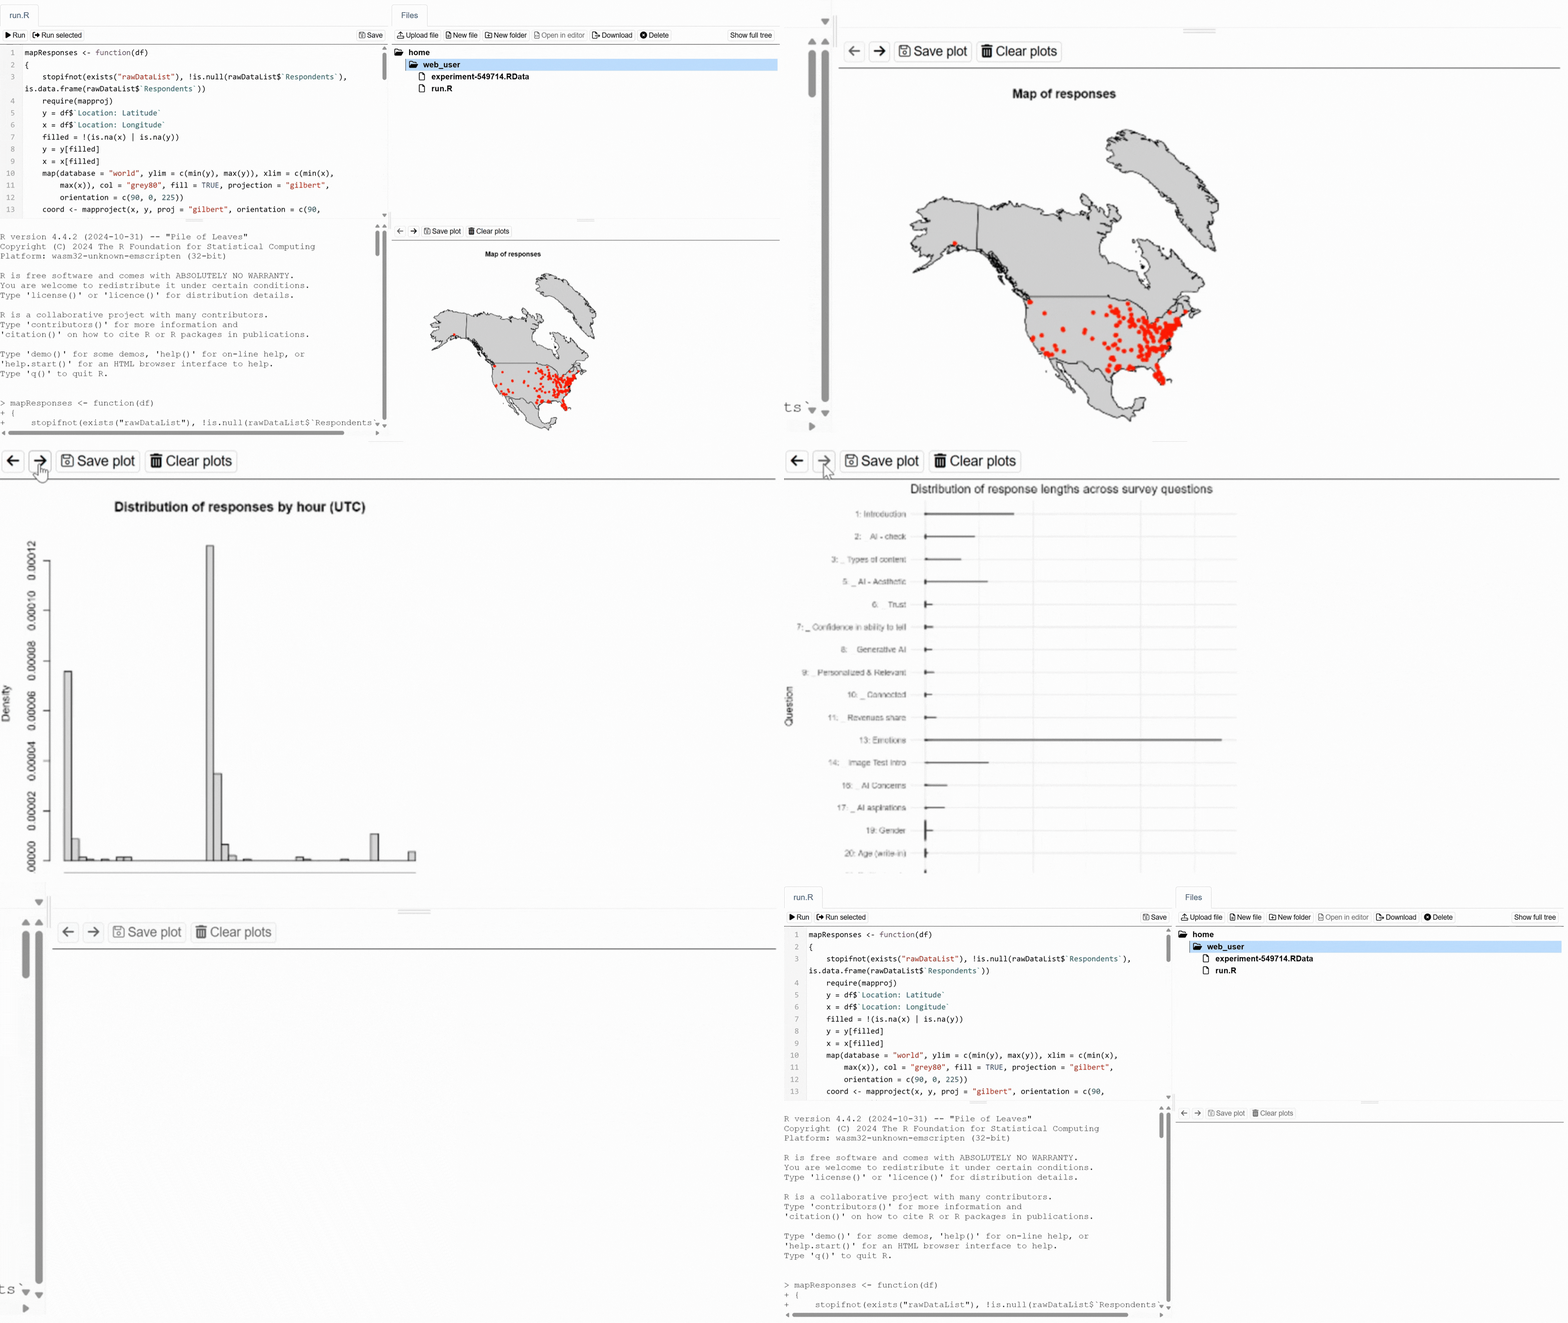
Here are some example outputs of these recipes. The appearance of visualisations may vary based on your dataset.
You can also save the outputs for external use.
Getting started with Recipes
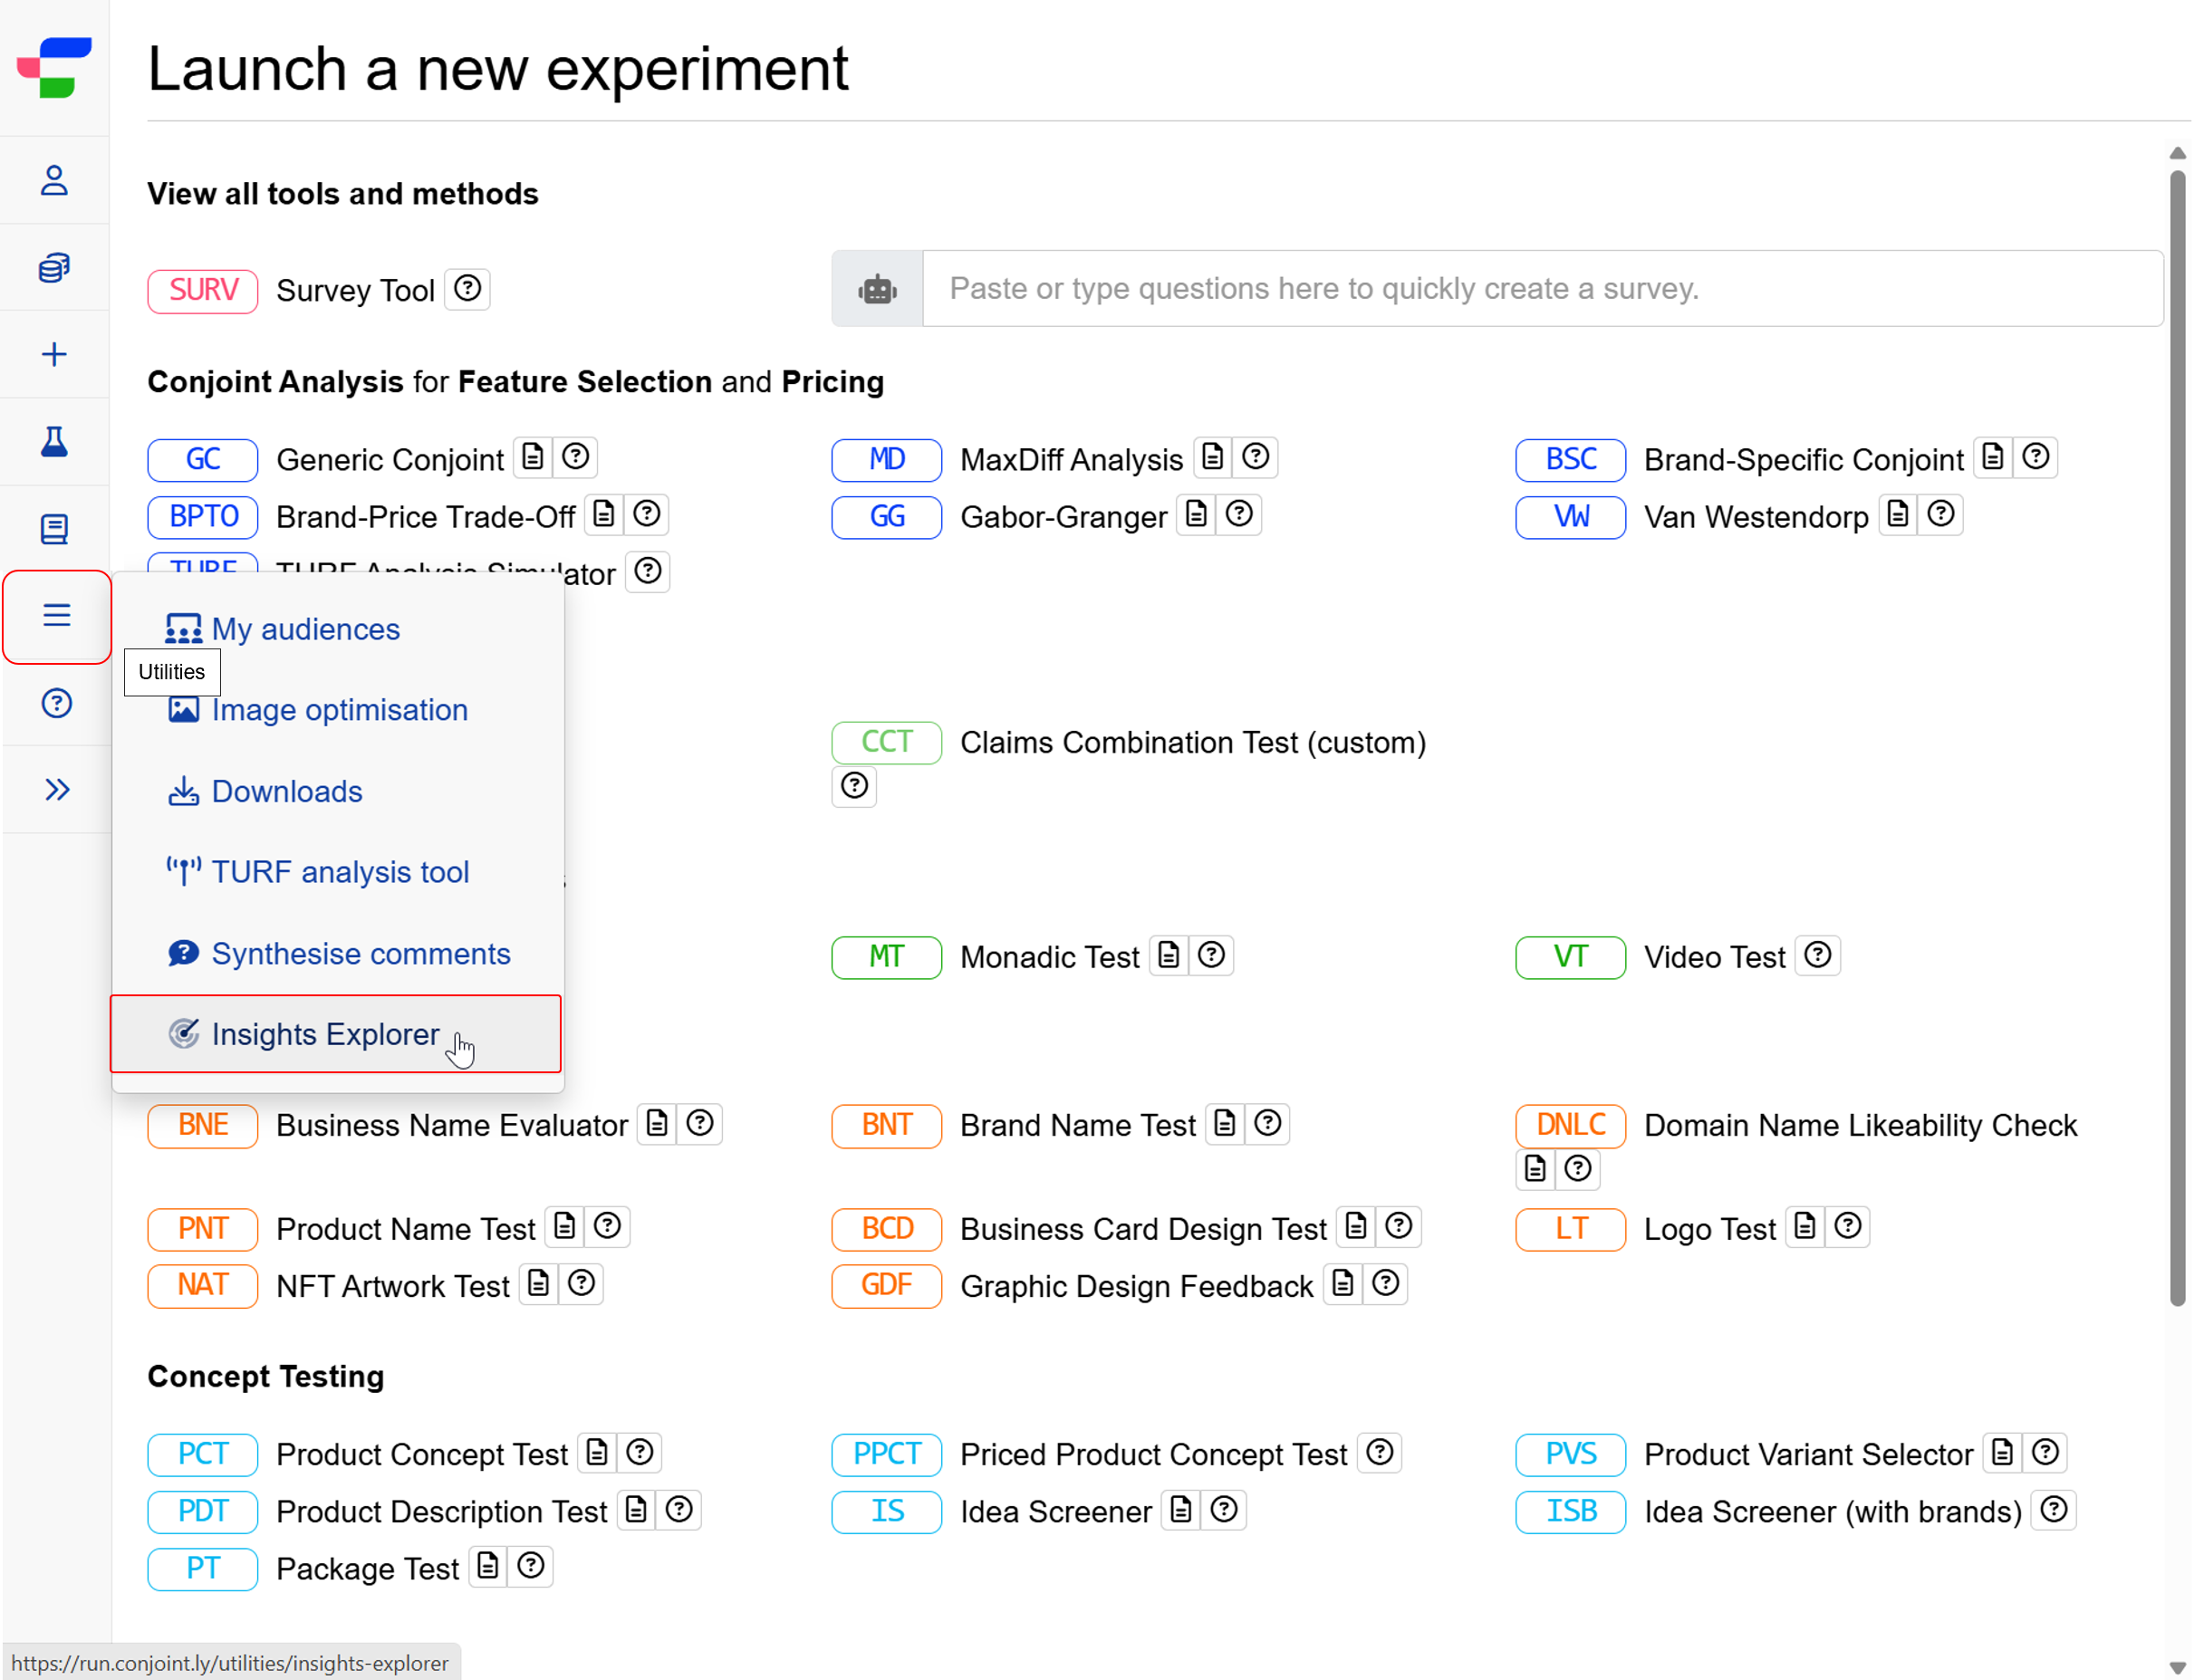
Open Conjointly’s Insights Explorer
The Insights Explorer is available for direct access without login. Conjointly users can find it under Utilities on the left-hand side menu, or access it directly from launched experiment reports.
Load experiment data
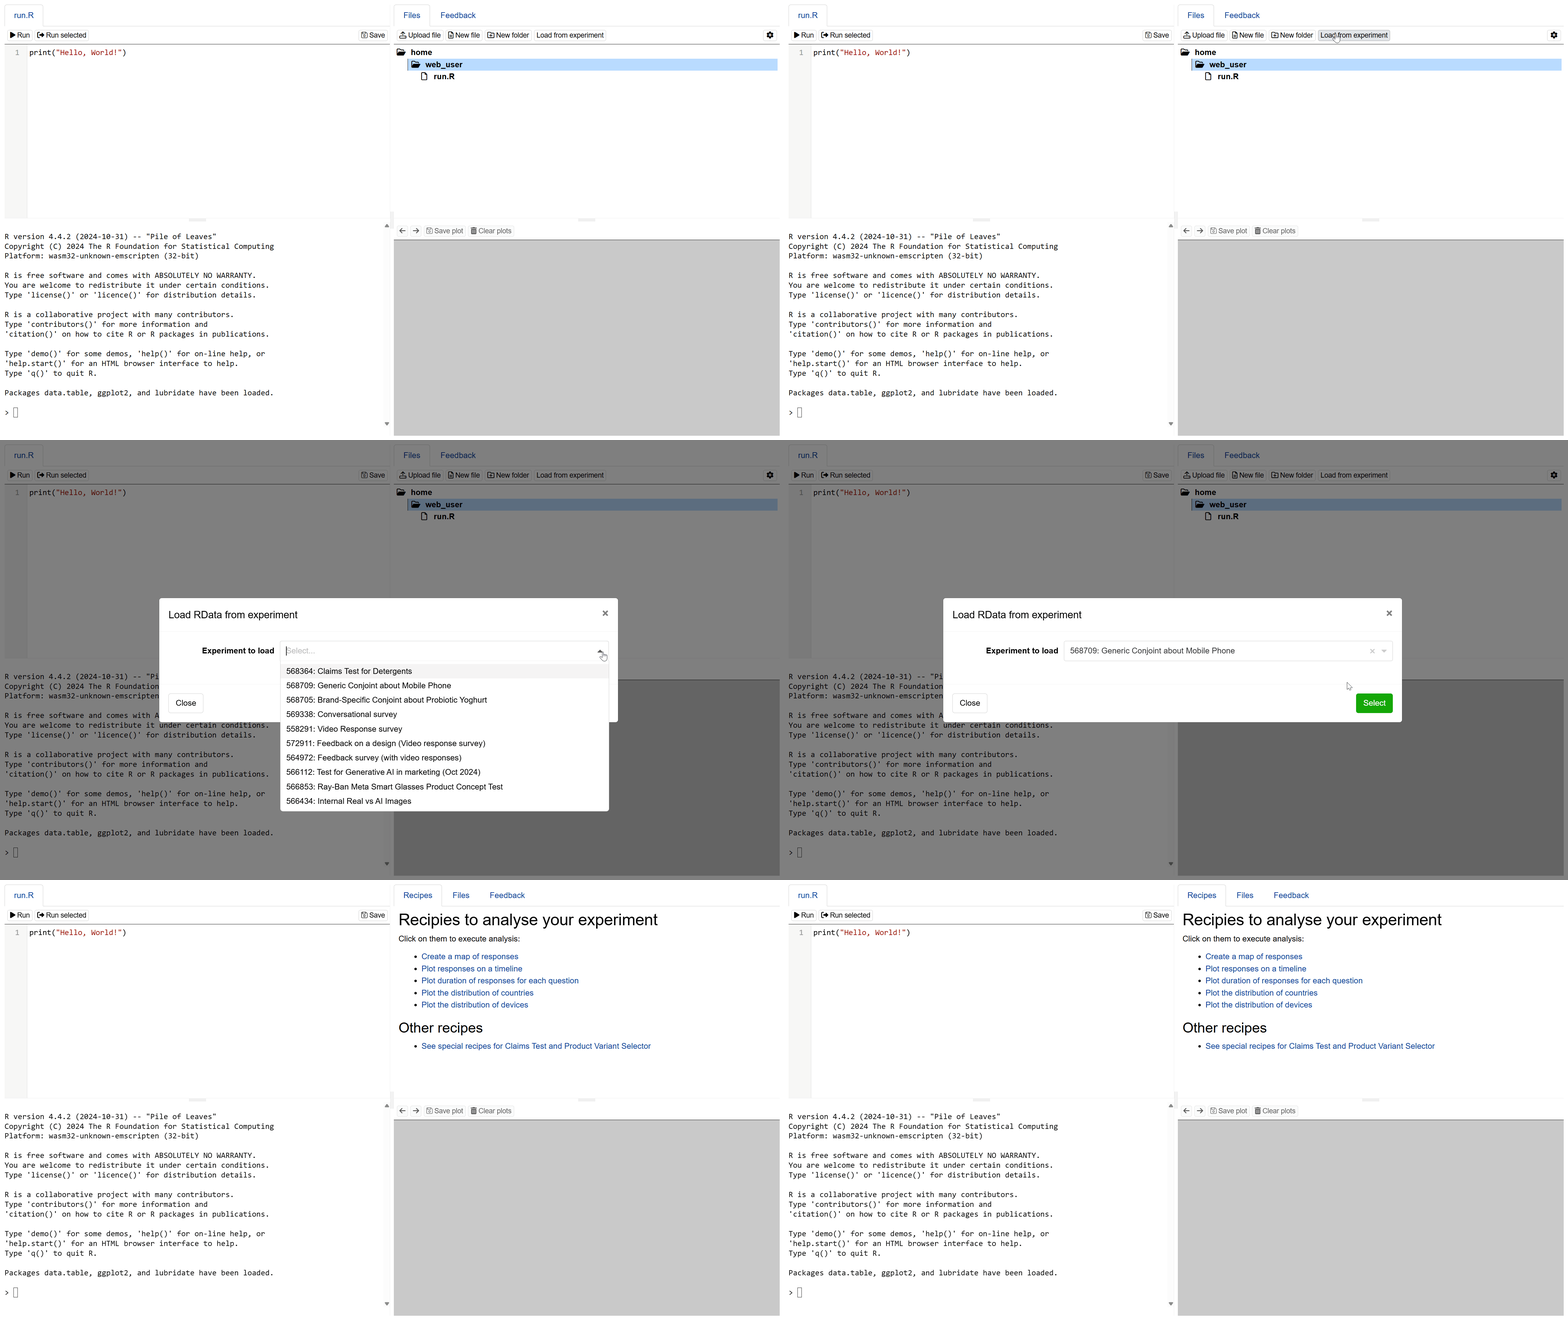
To load the Recipes tab:
- Navigate to the Files tab in the top-right corner.
- Click .
- Choose your experiment from the menu.
When you access the Insights Explorer directly from Conjointly experiments, the Recipes tab loads automatically.
Additional analysis options
Besides offering streamlined analysis through Recipes, Insights Explorer also supports:
- Working with multiple data sources: Load data from Conjointly experiments, upload your own data, and combine data for comprehensive analysis.
- Analysing data using LLM: Type your request on the LLM interface and run the generated code to produce your desired insights and visualisations without coding.
- Writing custom R code: Create customised analyses and visualisations using R functions and libraries.
Frequently asked questions
What are the system requirements to run Insights Explorer?
Insights Explorer runs in modern web browsers, including Chrome, Safari, Edge, Firefox, and more. No local installation or additional software is required.
Can I change the path to load the R WebAssembly software?
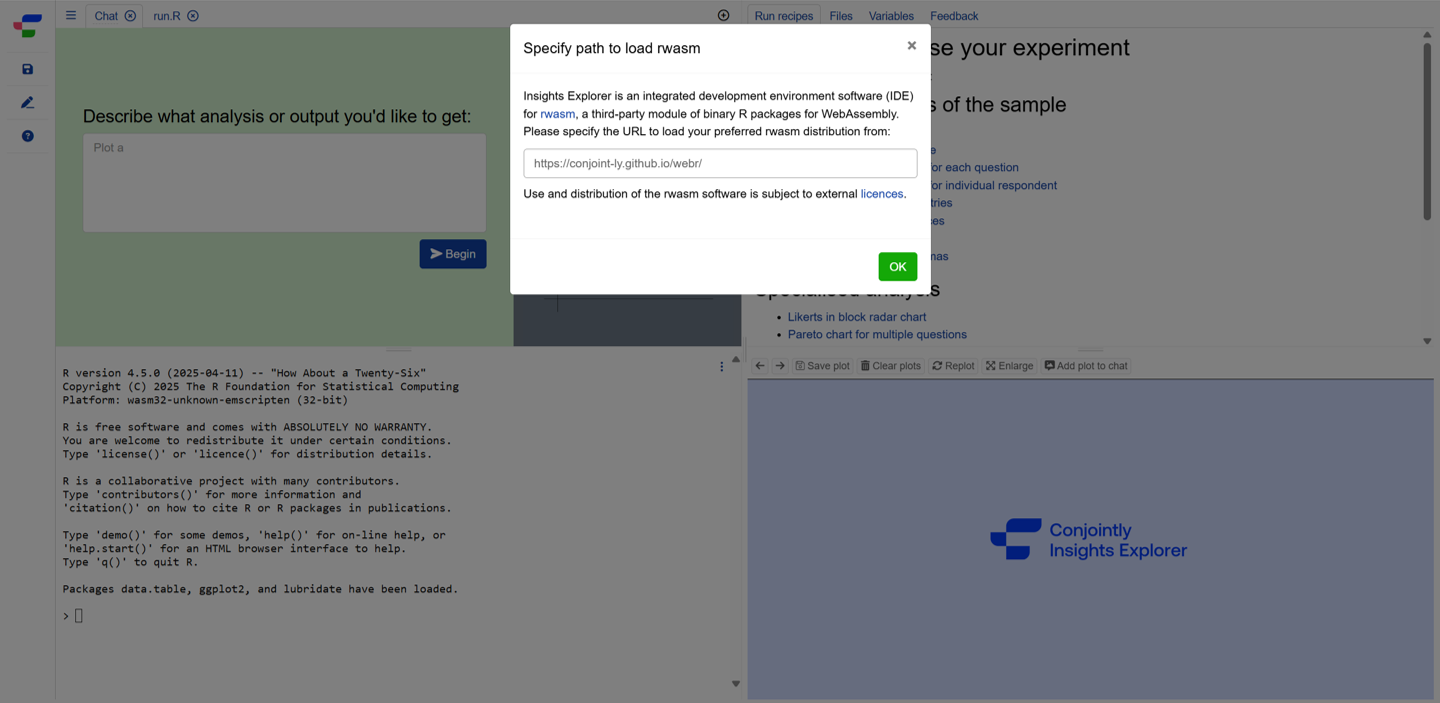
Yes. Simply click on the button on the left-hand-side menu.
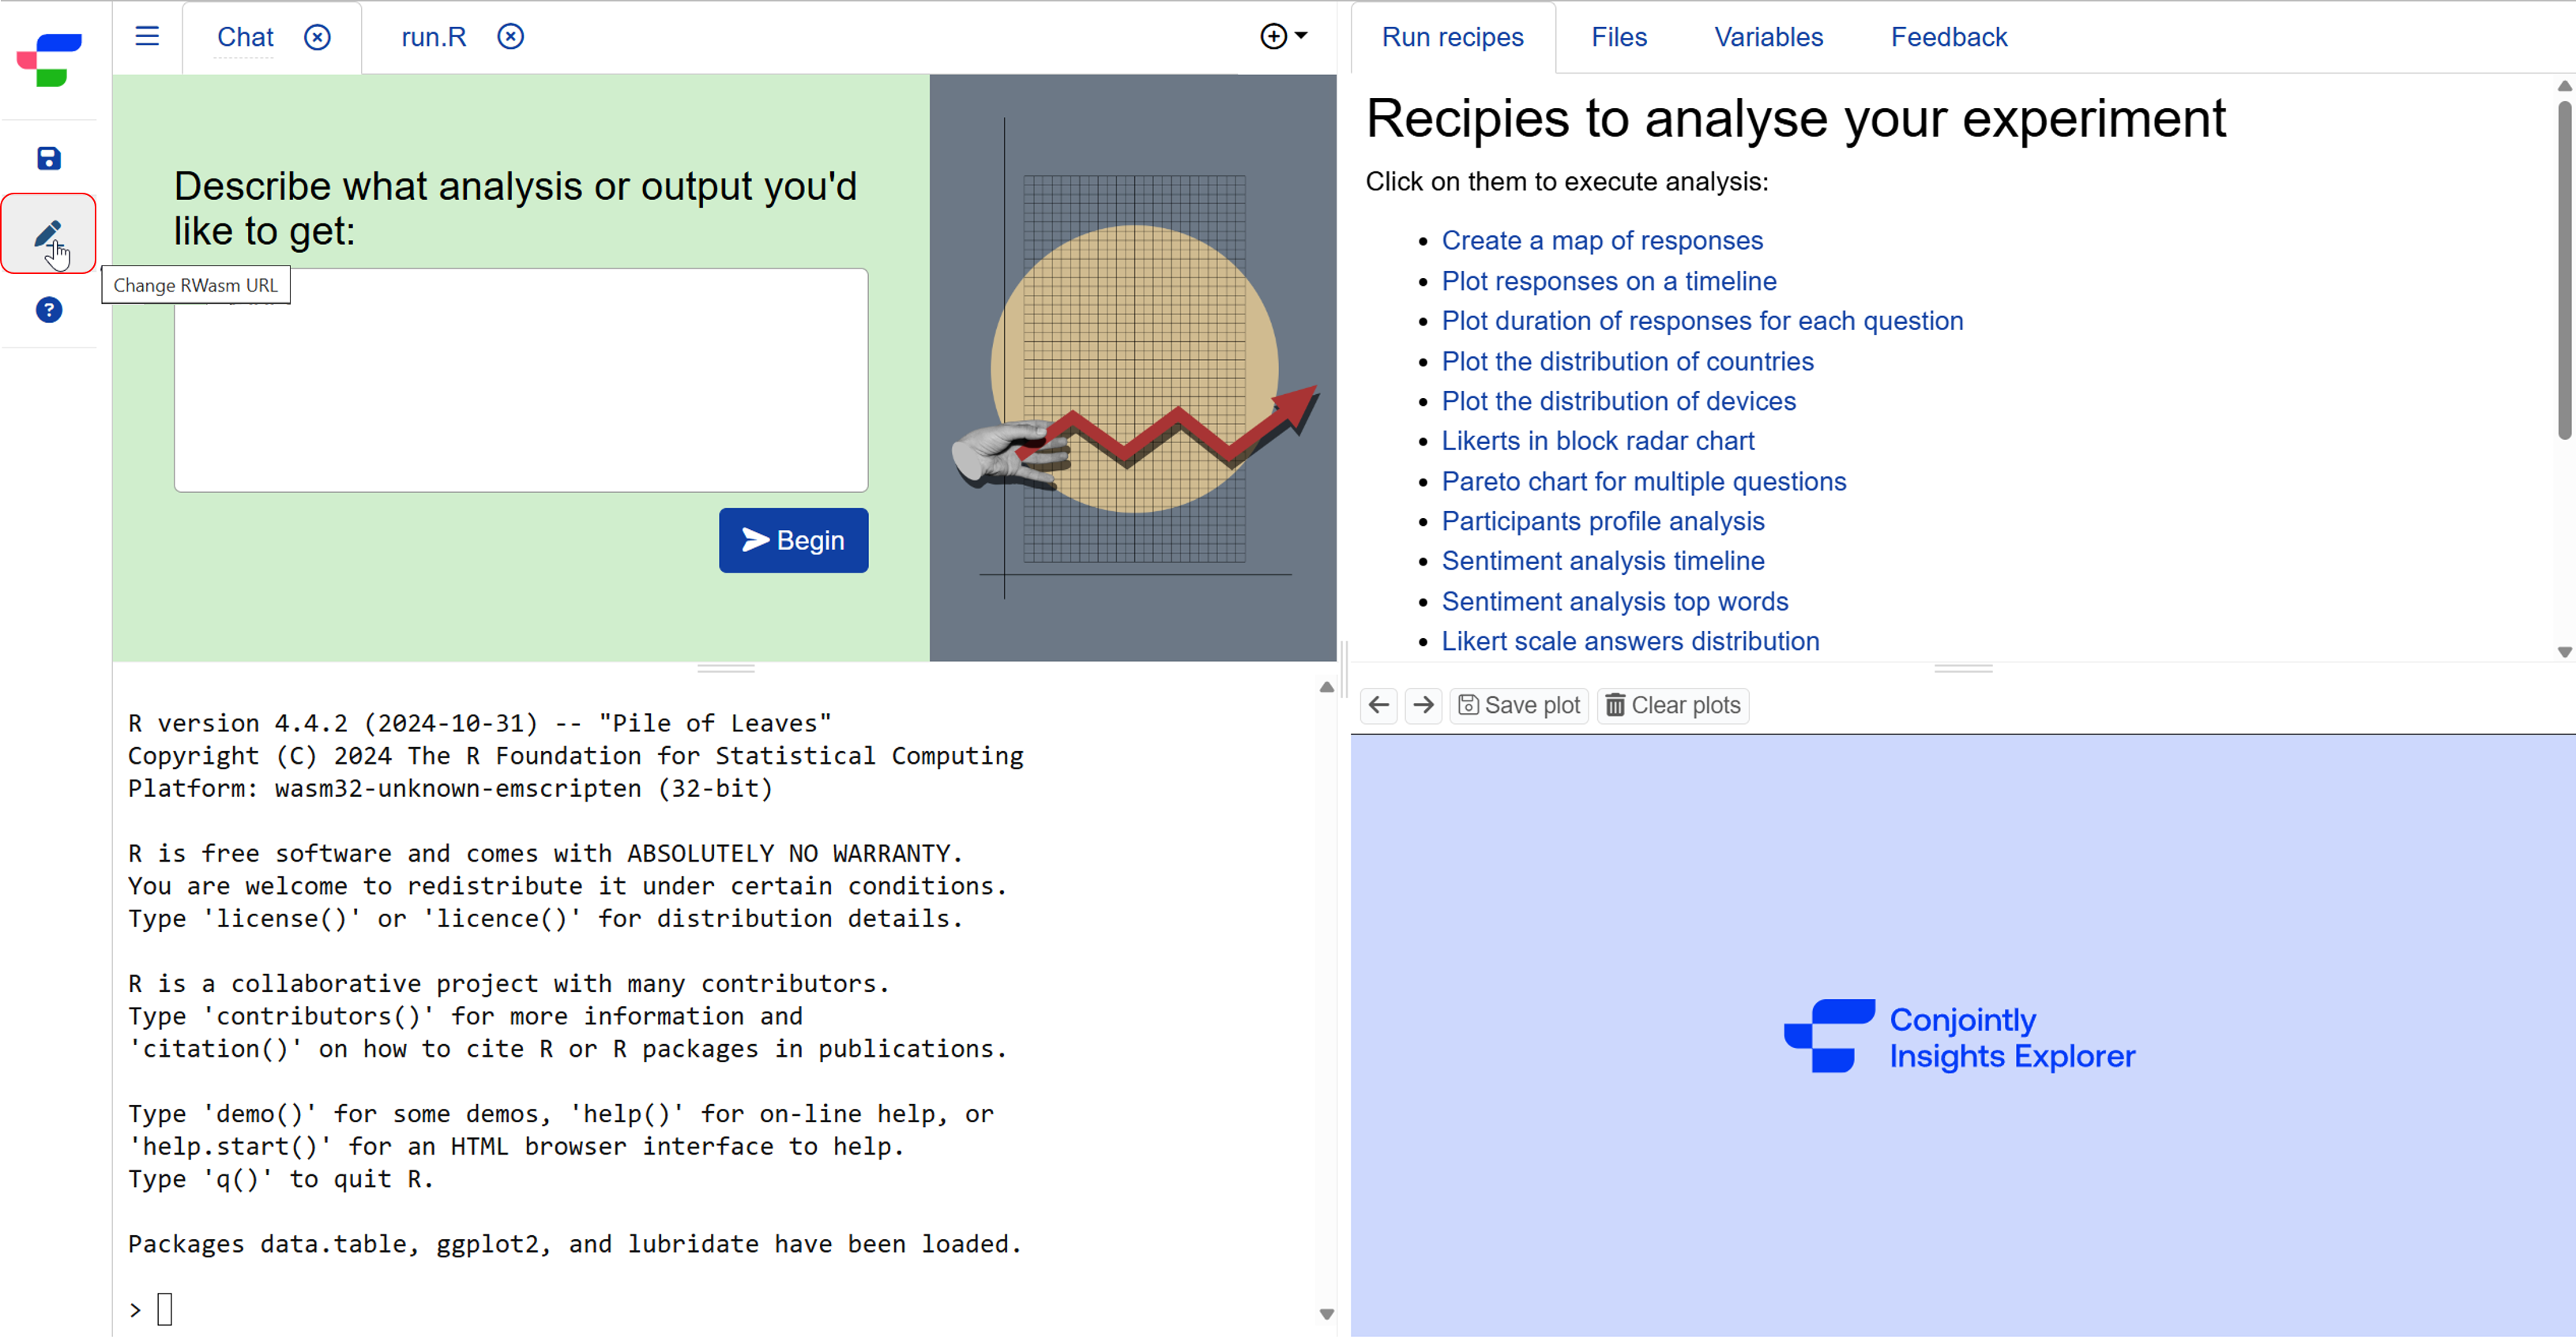
You will see an alert asking you to specify the path to load the R WebAssembly (R Wasm) software. While the default URL (https://conjoint-ly.github.io/webr/) is pre-filled, you can enter your preferred distribution URL if needed.
How do file management works in Insights Explorer?
The Insights Explorer initiates a new session each time you open the utility. Your files and work in Insights Explorer are session-based. This means:
- You can download your processed results and delete working files at any time.
- Any files you create, upload, or change remain available during your current browser session.
- Command history is maintained separately for each session.
When you log in to your Conjointly account, you can save your Insights Explorer session by clicking the the button on the left-hand-side menu.
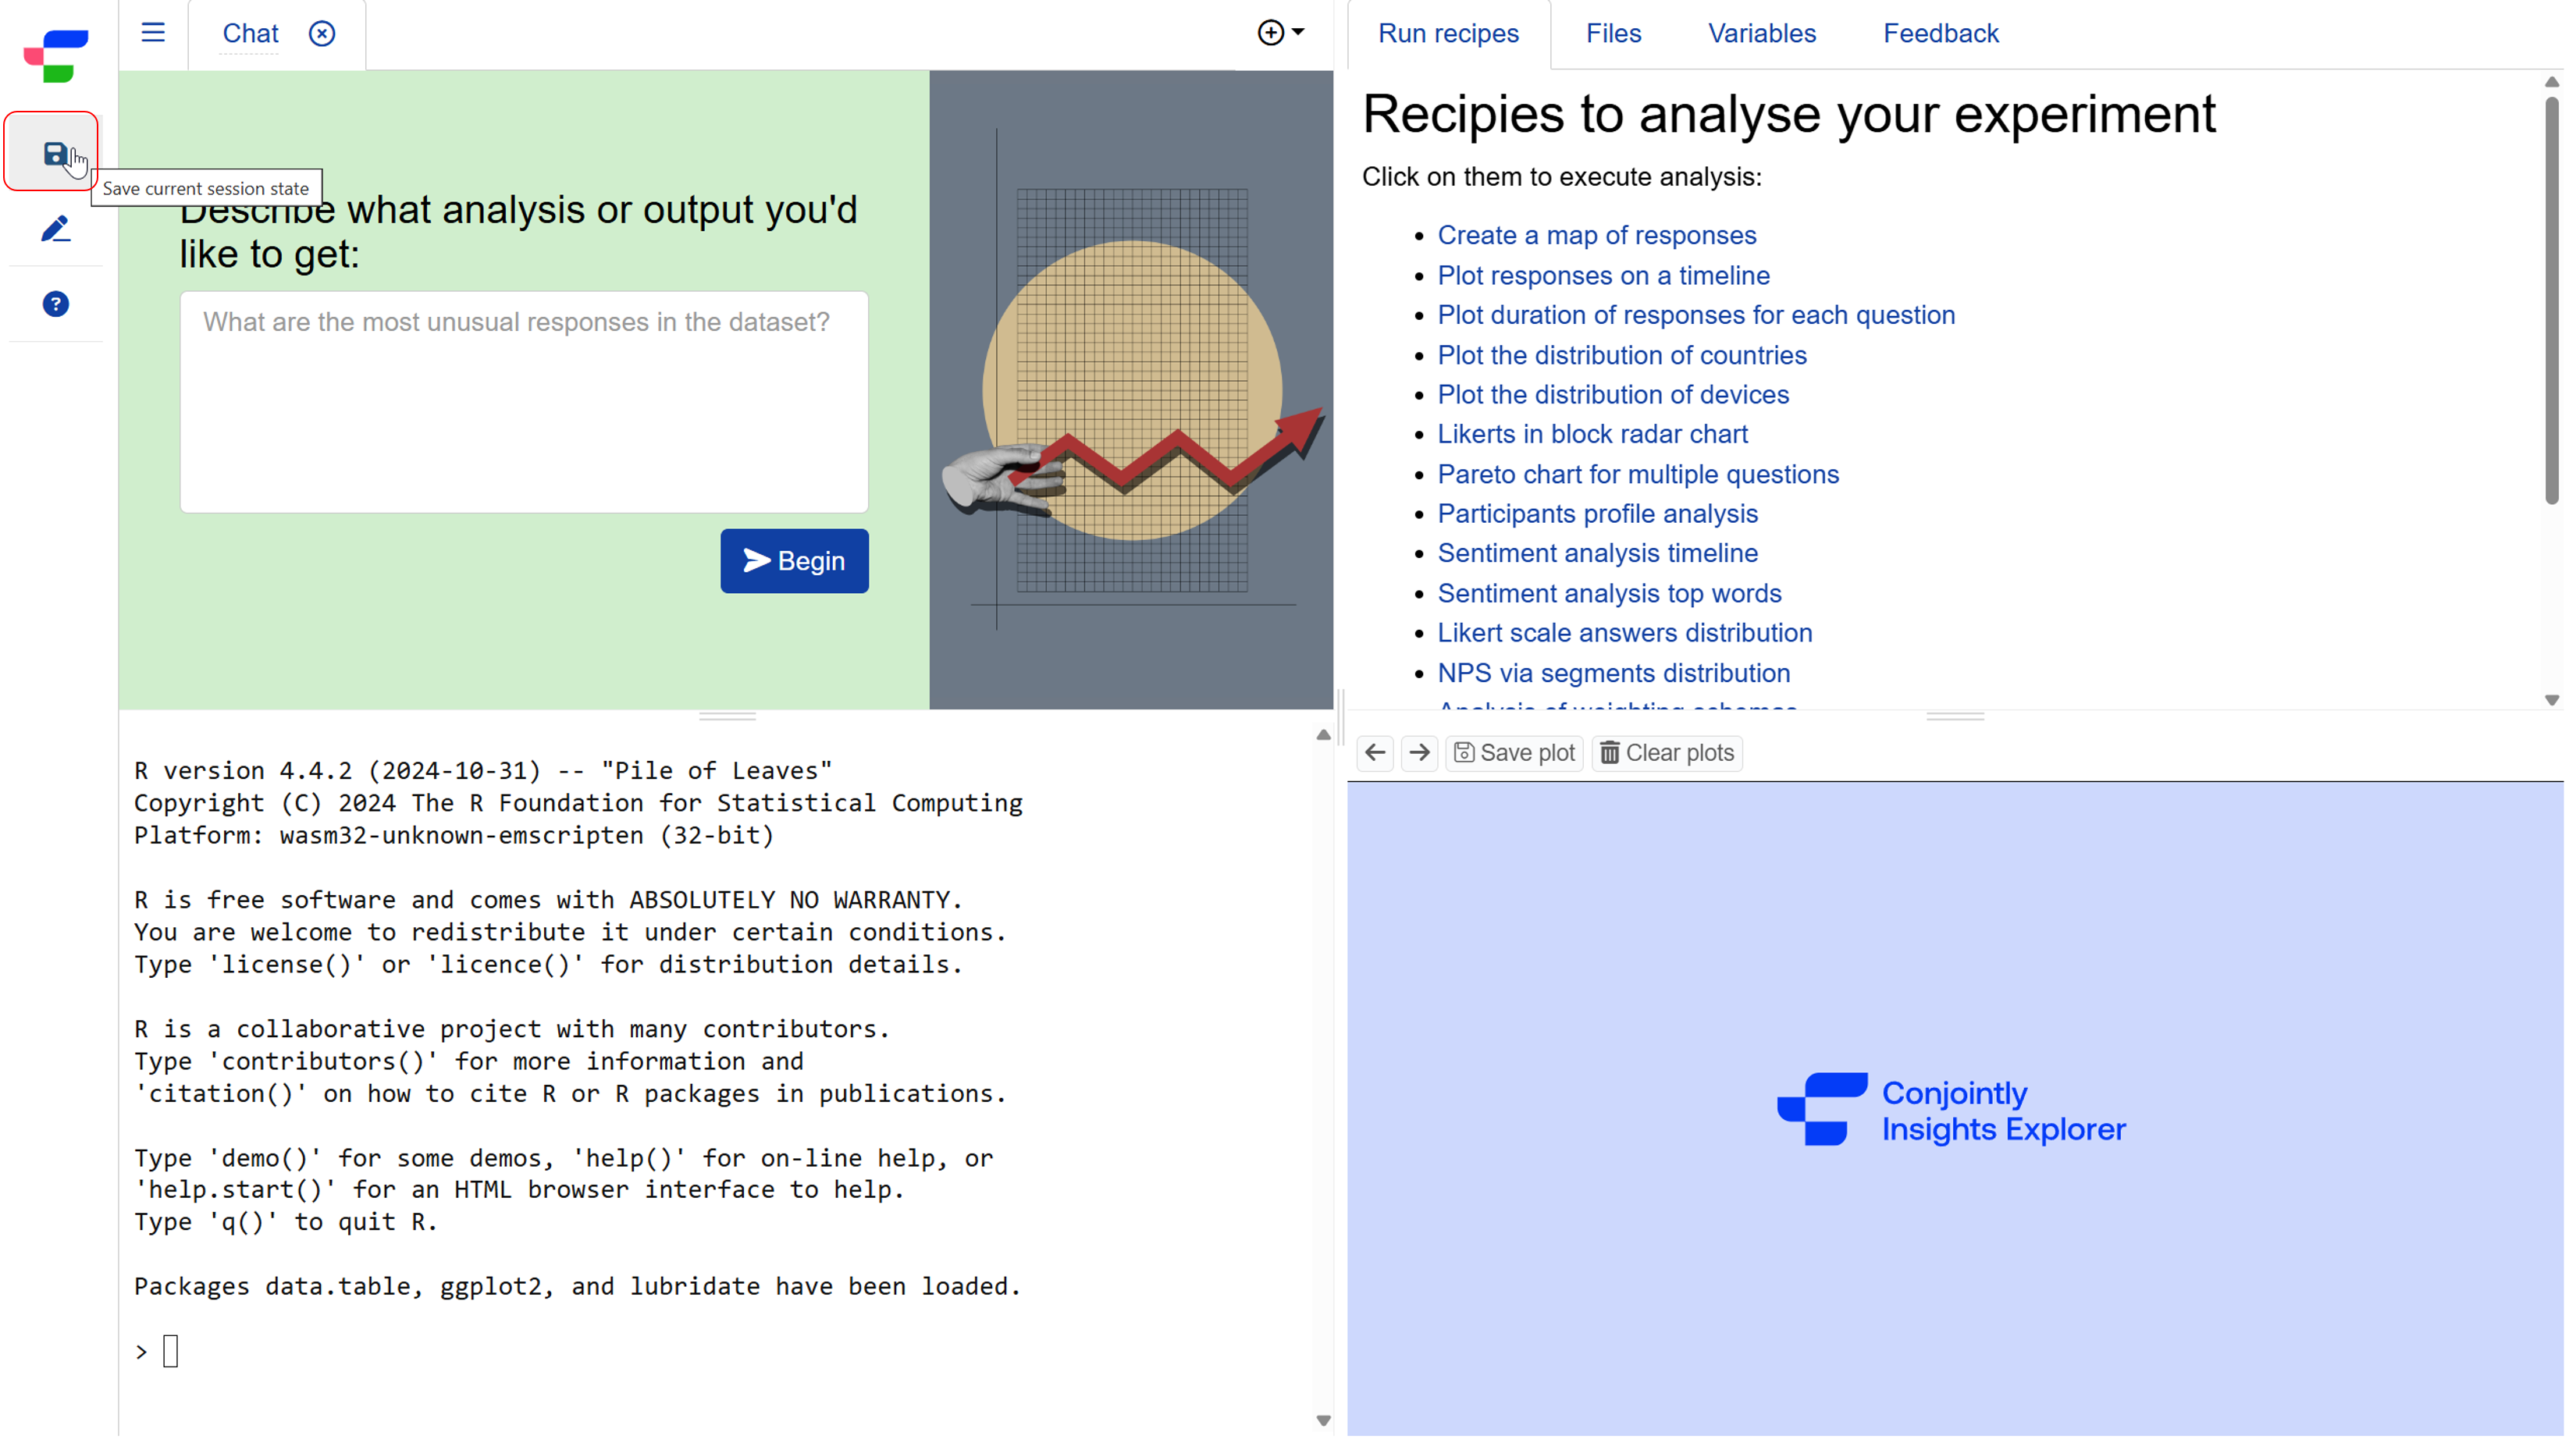
Please note that all unsaved session and working files are automatically cleared when you close Insights Explorer and cannot be recovered.
To load a previous Insights Explorer session, make sure you are logged in to your Conjointly account. A popup will appear when you open Insights Explorer. Select the session you want to load to continue working.

Can I save my visualisations?
Yes. The Plot tab includes several tools for working with your visualisations:
- Navigate between plots using the and buttons.
- as PNG file for external use.
- to start fresh.
- to rebuild the current plot with updated dimensions.
- to open the plot in a separate modal for better viewing and resizing.
- to return to the main insights explorer interface.
What libraries are available in Insights Explorer?
Insights Explorer comes with the following pre-installed R packages:
- All standard packages of WebR.
ggplot2: Creates statistical data visualisations using a layered approach. Useful for building complex plots from simple components.data.table: Handles large datasets with high-performance data manipulation. Offers enhanced features for subsetting, joining, and updating data.lubridate: Simplifies working with dates and times in R. Helps parse date-time data and perform date-time calculations.
You can also load additional packages based on your analysis requirements.
Next steps
You can also read about: