Add calculated variables after data collection
With Deep probe, you can add calculated values to create new calculated variables from your existing data using formulas, extending your analysis capabilities beyond your original survey design.
You can combine multiple responses into composite scores, categorise numerical data into meaningful ranges, or apply logical evaluations that weren’t initially captured. All calculate values are processed without additional fees.
Working example 1: Categorising responses into segments
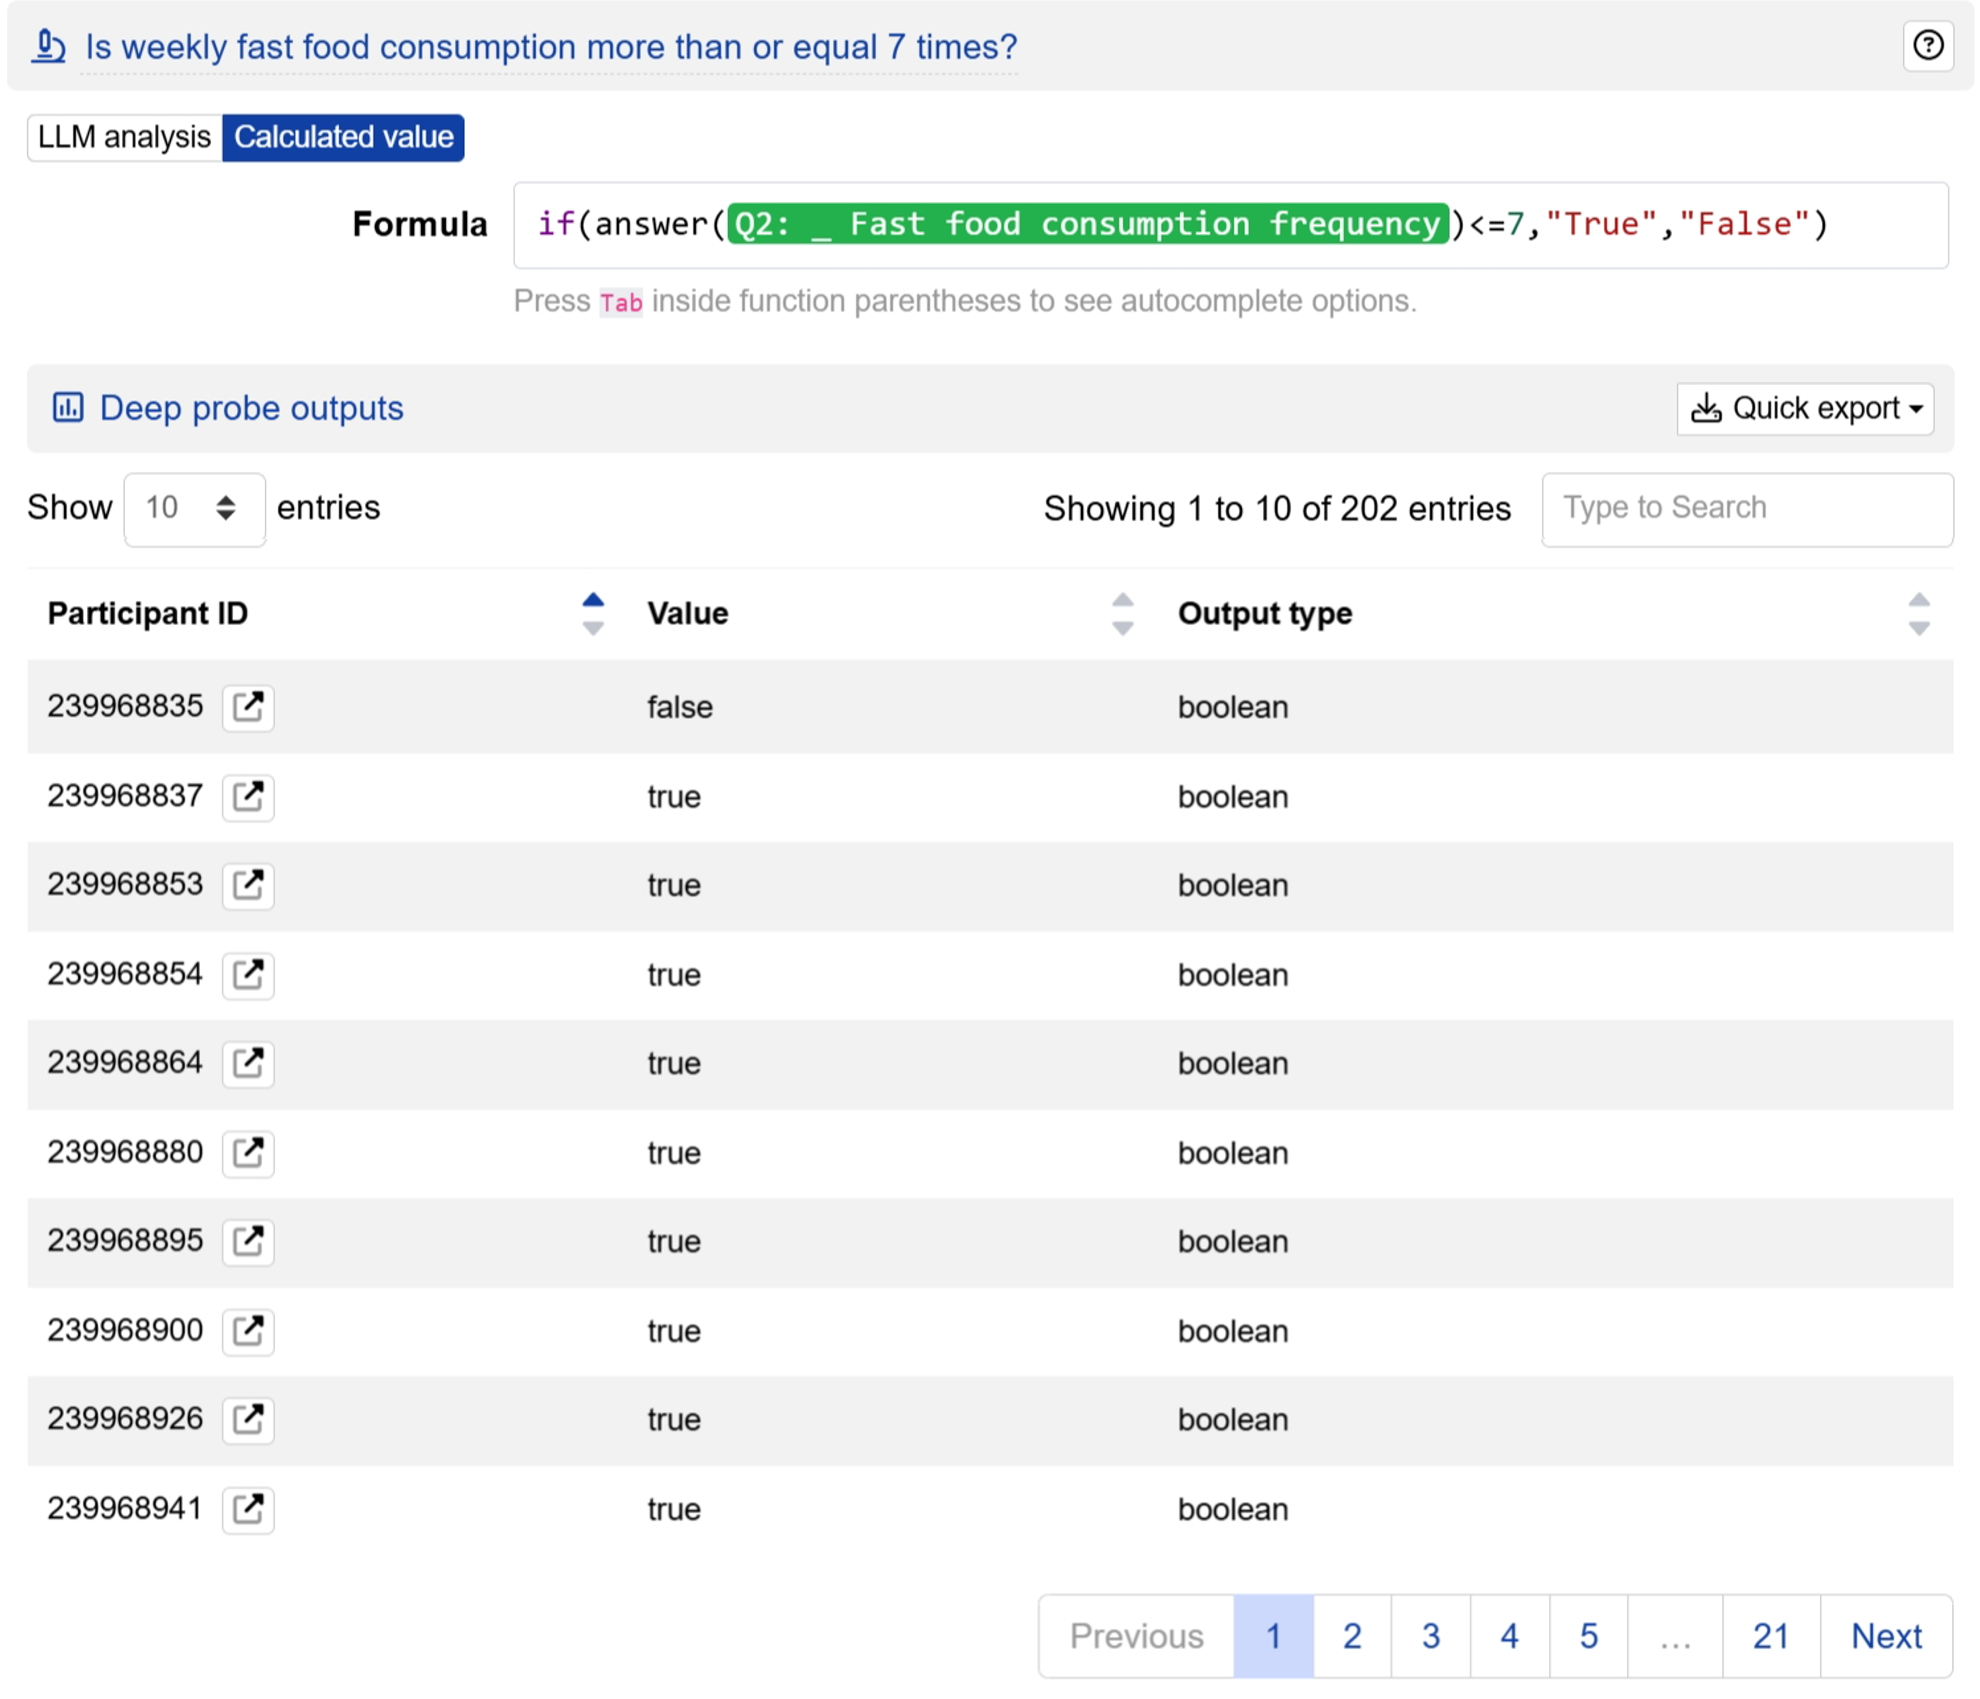
The following example shows how researchers automatically classify respondents based on whether their stated weekly fast food consumption exceeds 7 times.
The formula used in the example : if answer()<= 7, "True", "False")
The Deep probe outputs generates the values in boolean format for each individual respondent.

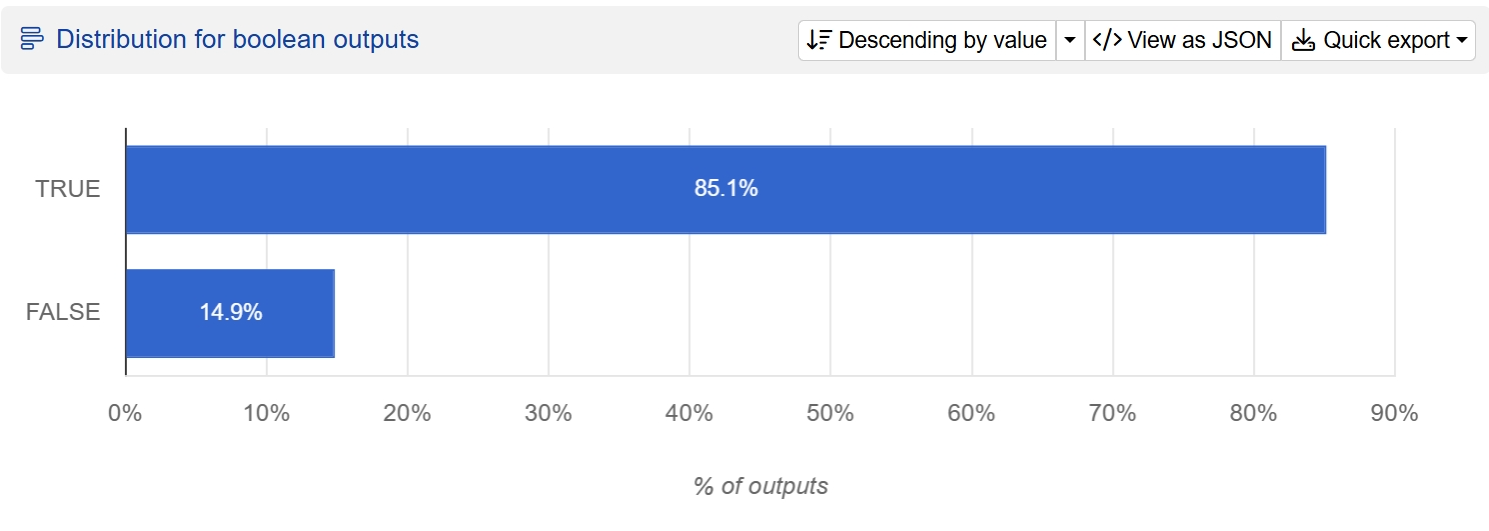
On the Summary for boolean outputs tab, you will find the distribution chart of responses. In this example, 85.1% of respondents consume fast food 7 times or more per week, compared to 14.9% who consume it less frequently.

Working example 2: Computing scores from responses
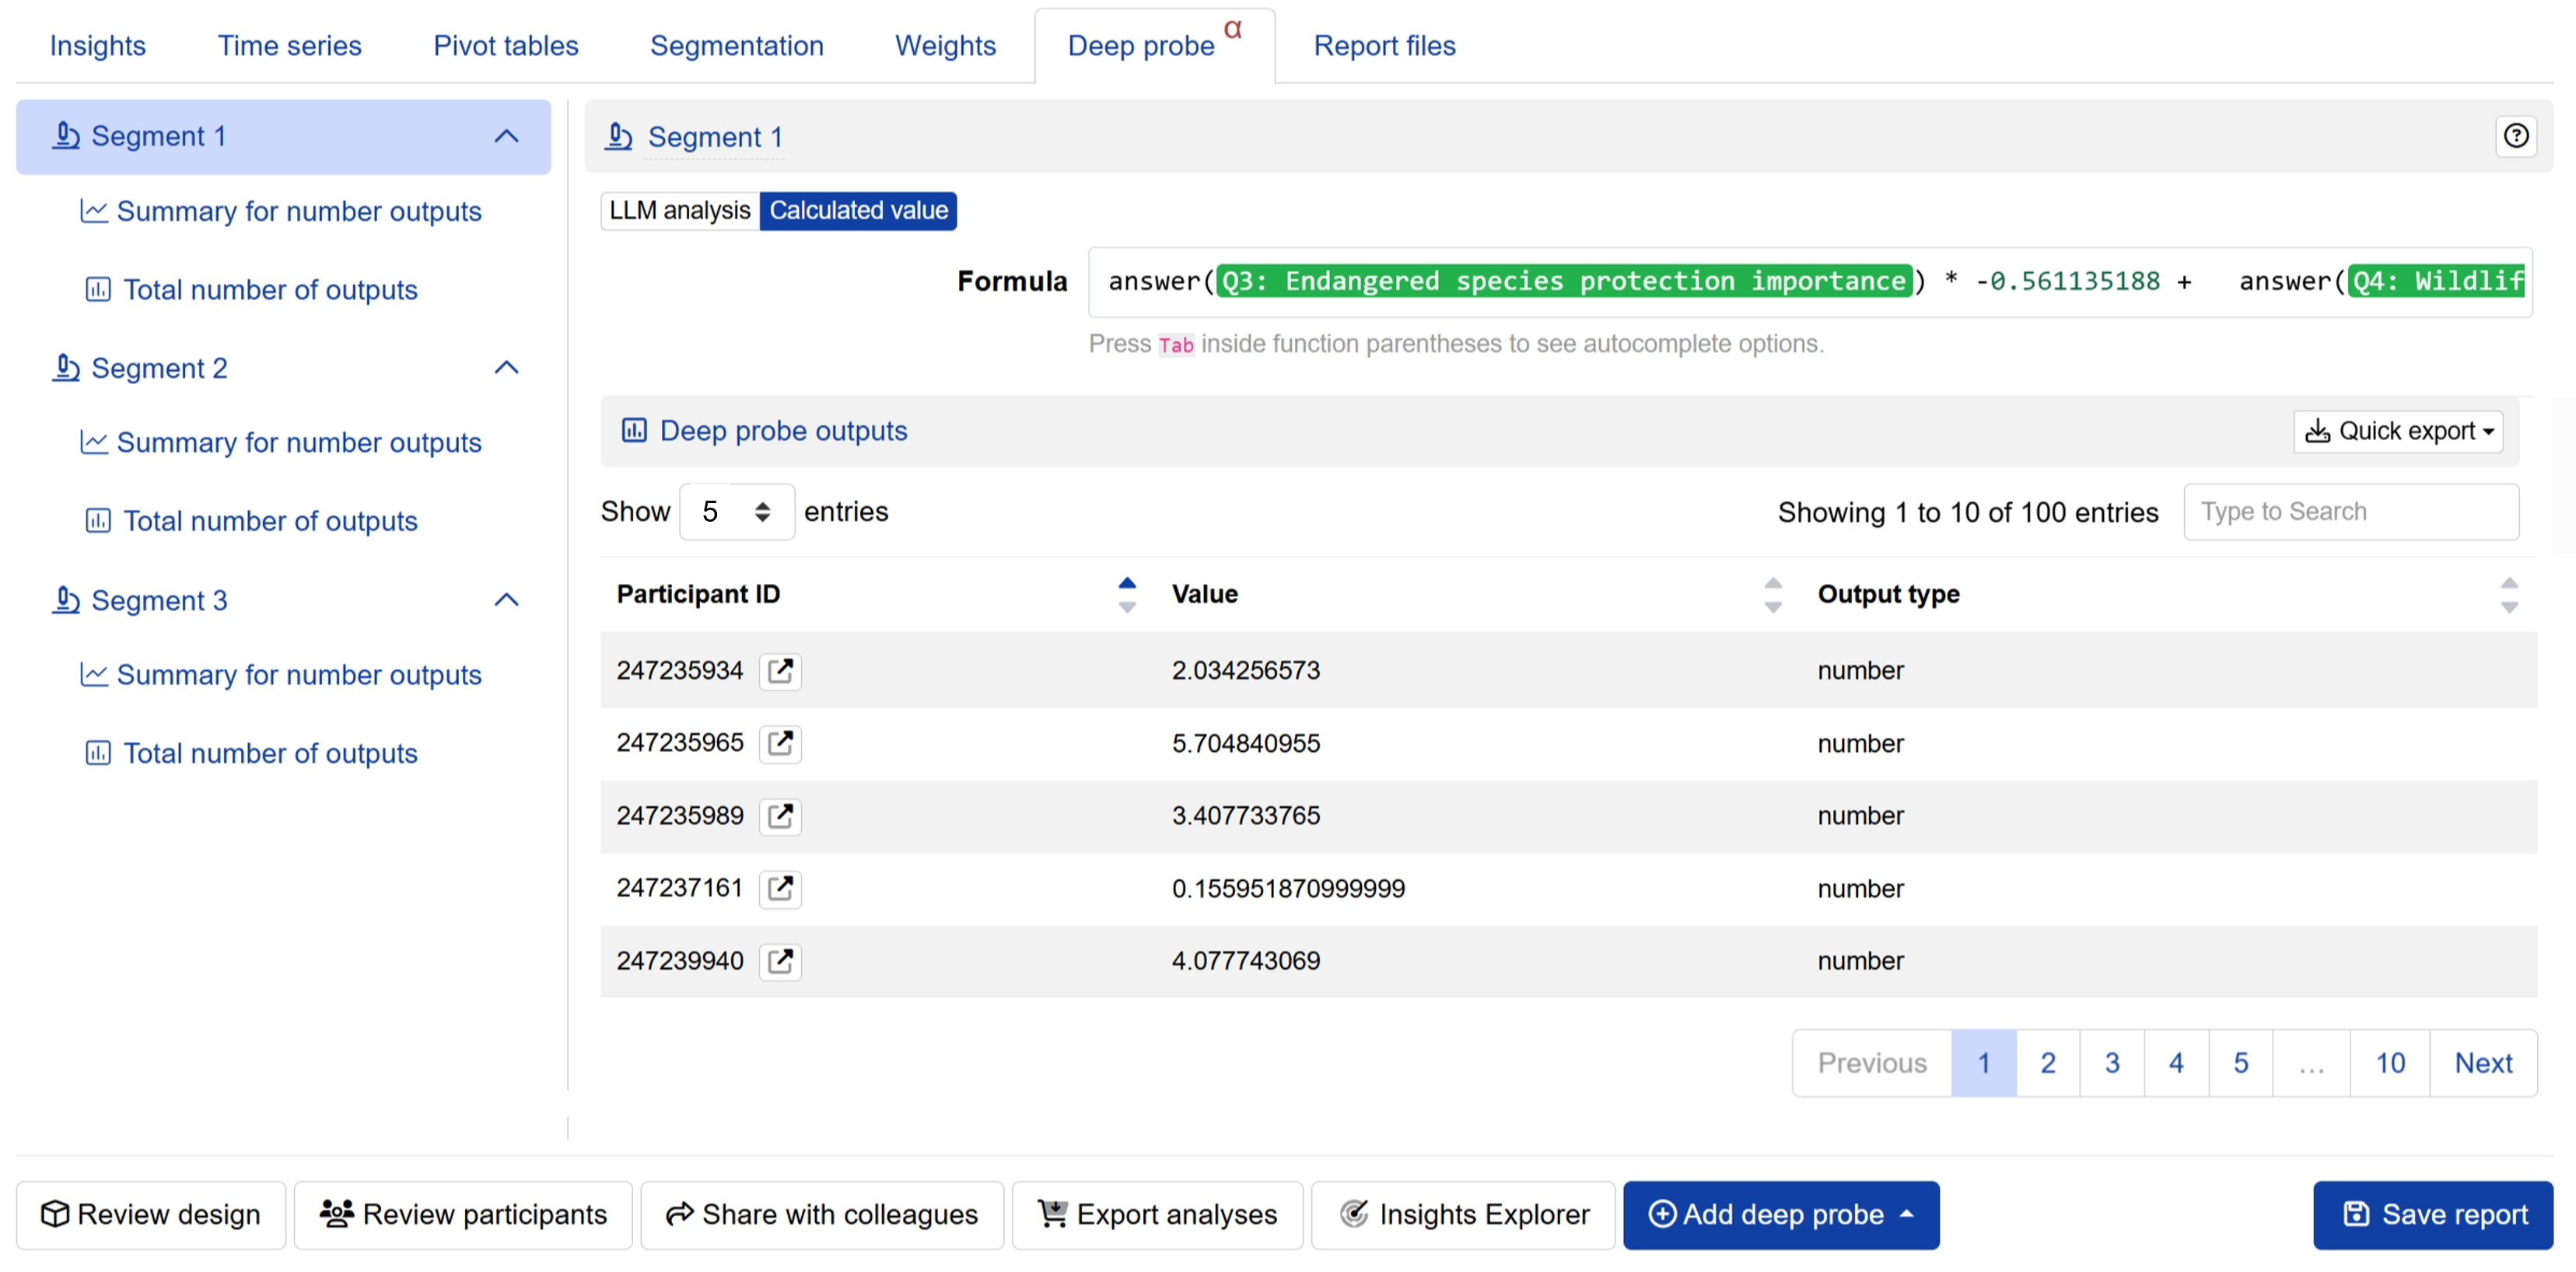
Through the formula interface, you can easily apply mathematical operations to combine multiple survey responses into composite scores. The following example demonstrates how to create a composite score for a particular user segments based on four environmental attitude question responses.
The formula used in the example : answer( * -0.561135188 + answer() * -0.351733944 + answer() * -0.65961061 + answer() * -0.559083482 + 9.802423437
The Deep probe outputs generates the score for each individual respondent.

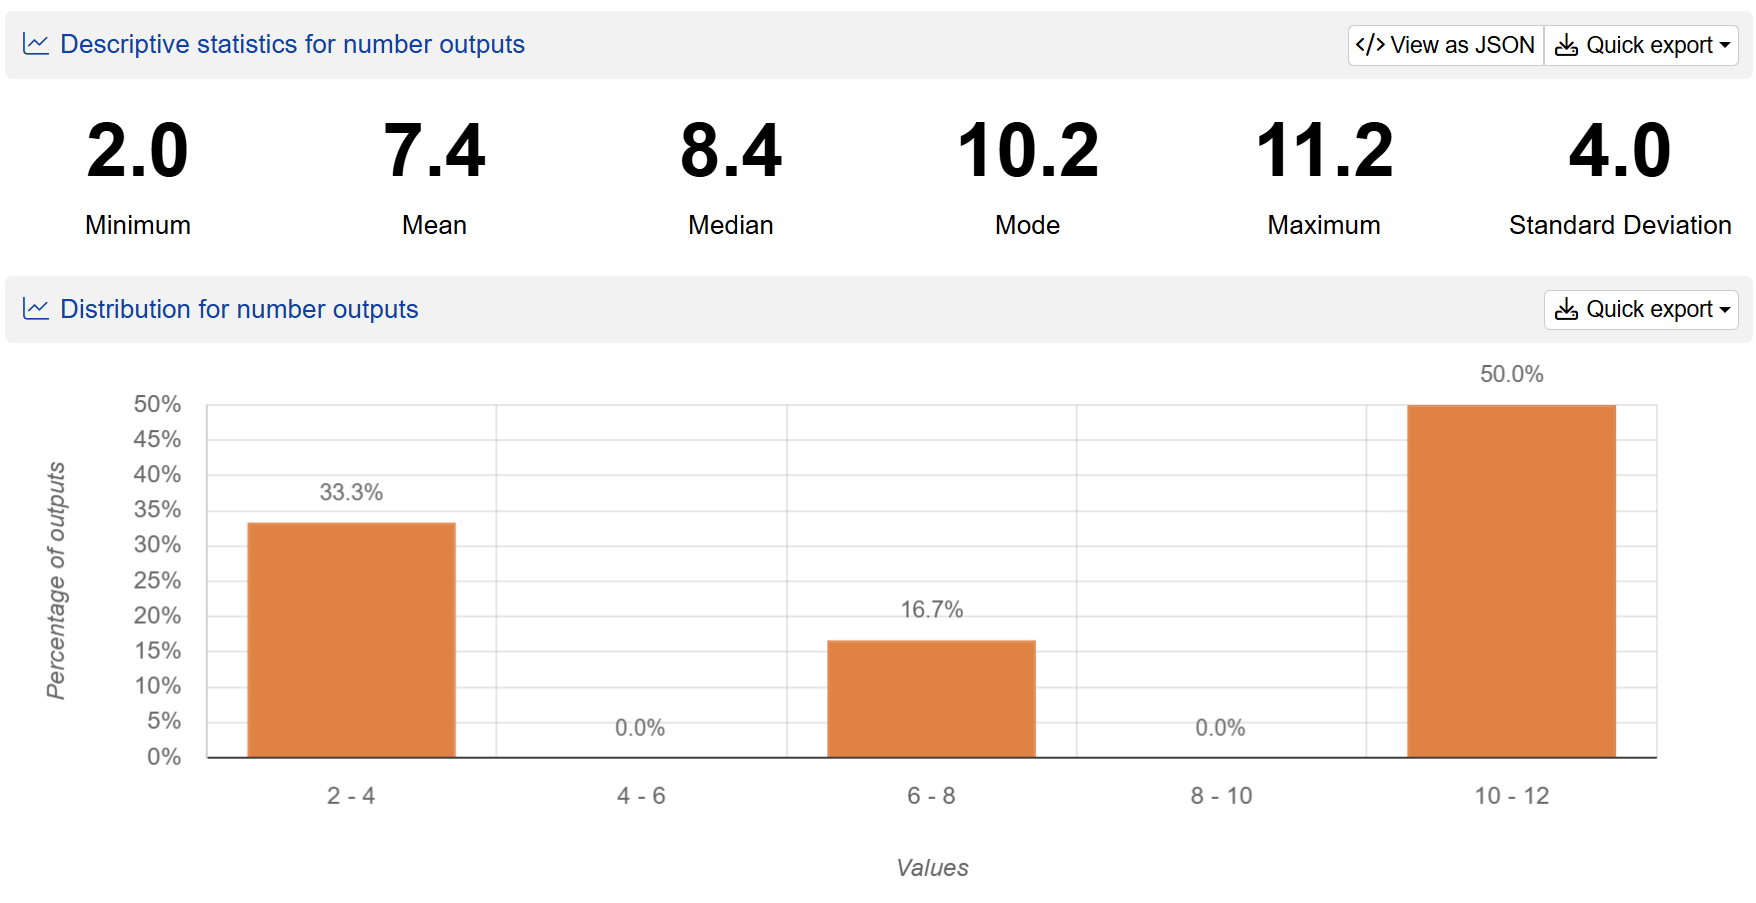
On the Summary for number outputs tab, you will find the distribution chart for grouped number ranges.

Best practices for calculated variables
- Test formulas incrementally using preview function before full processing.
- Name each deep probe clearly to indicate its calculation purpose.
- Consider data types and ensure formula logic matches your analysis needs.
- Validate calculations by spot-checking results against original response data.
Other Deep probe use cases
You can also read about: