What are confidence intervals?
Confidence intervals are a way of dealing with uncertainty in the data. Instead of showing a single exact number, they show a range of values where the true result likely falls.
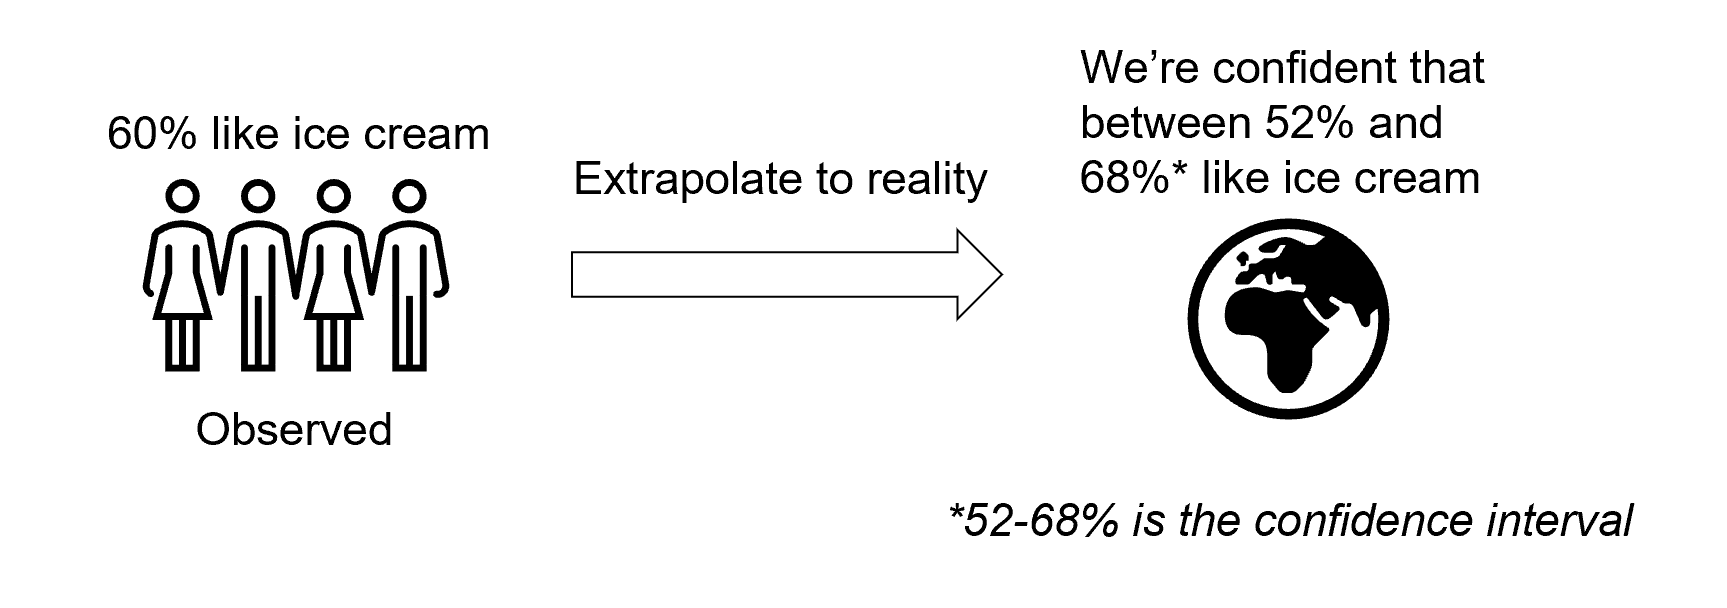
For example, let’s say we want to find out how many people like ice cream. We survey 100 people and 60 of them say they like ice cream. Instead of simply reporting “60% of people like ice cream”, we calculate a range of values based on our desired confidence level. For instance, with a 90% confidence level, this might give us a range of 60% ± 8% (52-68% of people like ice cream).
Confidence intervals are more accurate than using single observed data points because results vary between different groups of people. If we had asked a different group of 100 people, maybe 63% would have said they like ice cream, and if we asked yet another group, perhaps 55% would have said they like ice cream. The confidence interval helps us account for these potential variations and gives us a more reliable estimate of the true percentage in the overall population.

How to interpret confidence intervals
Conjointly includes confidence intervals in your reports. To understand what they mean, consider the following key aspects:
- The range tells you between which values the true value likely lies.
- The confidence level tells you how sure we are about the range. For instance, a 90% confidence level means if we conducted the same survey many times with different random samples, 90% of the calculated intervals would contain the true population value. Conjointly’s default confidence level is 90%.
- When the confidence intervals of two attributes overlap, we can’t be certain there is a significant difference between these attributes. If their confidence intervals don’t overlap, the two attributes are significantly different from each other.
You can also view confidence intervals in the Conjoint Preference Share Simulator.
What affects confidence interval size
The size of a confidence interval represents the range between its upper and lower bounds of where the true result likely falls. A narrow confidence interval indicates more precise estimates of the true results, while a wide confidence interval suggests less precision in the estimates.
Several factors influence the size of confidence intervals. These include:
- Statistical confidence level
The confidence level indicates how often the interval would contain the true result if the survey was conducted repeatedly. For example, a 90% confidence interval for ice cream preference shows that 60% ± 8% of respondents like ice cream, meaning the true percentage falls between 52% and 68% in 90% of repeated surveys. If we want to be more certain, increasing the confidence level to 99% would widen this interval to 60% ± 15% (45% - 75%), offering greater certainty but less precision in the estimate. - Sample size
A larger sample size better represents the overall population, leading to more precise estimates, hence smaller confidence intervals. For example, a survey with 100 respondents showing 60% who like ice cream might have a confidence interval of 60% ± 8% (52-68%). Increasing to 1,000 respondents might narrow the interval to 60% ± 3% (57-63%). - Response variation
When responses display higher variation across different values, the uncertainty in the estimate increases, leading to wider confidence intervals. For example, in a rating scale survey, if most responses cluster around a similar score, the confidence interval will be relatively narrow. However, if ratings are spread widely across all possible scores, the confidence interval becomes much broader, reflecting greater uncertainty in the true population value.