

Are LLMs destroying online survey data quality? We explore the threat of AI survey bots, detection using cognitive traps, and estimate actual fraud prevalence.
Large Language Models (LLMs) pose a serious, evolving threat to online survey research. LLM-based agents can interact directly with web browsers and complete surveys with very little or no human input. These models are growing increasingly capable, for example in their ability to overcome anti-bot measures. The barrier to entry has also been dramatically lowered thanks to easily accessible commercial, off-the-shelf agents such as ChatGPT Atlas, Perplexity Comet, Claude for Chrome, Manus, or Skyvern. In theory, anyone can deploy their own survey bot and direct it to participate in any study, from yogurt pricing research to party polling.
Challenges related to data quality are, of course, nothing new in online survey research. Responsible research companies like Conjointly have long-established, effective methods to ensure high-quality responses. However, fraud-by-LLM, in both qualitative and quantitative terms, is fundamentally different.
First, it offers unprecedented scale. Even fraudulent enterprises such as click farms, which rely on human labour, cannot compete with automated bots. While traditional click farms can still be economically competitive with LLMs for now (Wang et al 2026), this is unlikely to continue as token costs fall.
Second, LLMs can assume a consistent persona. Low-quality human data - whether generated by inattentive respondents or fraudsters - is often marked by internal inconsistencies, impossible claims, and other mistakes. LLM respondents can easily avoid these pitfalls by playing a role assigned to them. The new generation of agents has also become more human-like by incorporating computer vision (older generations interacted with browsers via text, i.e. the underlying HTML). This means they are no longer susceptible to simple traps embedded in the HTML (for example, questions or answer options invisible to the human eye) and process information in a similar way a human would.
These are all very good reasons to be worried about the future of online survey research. But are the apocalyptic predictions of some researchers (e.g. Westwood 2026) actually coming true? Below, we look at the current state of the threat and investigate how prevalent bot respondents actually are among Conjointly’s panel suppliers.
Off-the-shelf agents: how do they fare?
To find out, we tested a number of off-the-shelf tools - such as Claude for Chrome, Manus and Skyvern directly on the Conjointly platform. All of these tools are more than capable of completing a typical market research survey. Some may initially express qualms about performing such tasks, but they are easily convinced to carry on. In our tests, we simply assured the agents that they were being used to bolster the defences of our platform, and they took our word for it.
However, when put to work, all tested agents failed for one of three reasons:
- They failed to convincingly replicate human respondent characteristics such as typing speed or mouse movement (behavioural metadata). Even when explicitly asked to mimic human behaviour - typos, corrections, mouse movement - they were still detected by mechanisms used by Conjointly.
- Most do not run on the user’s computer but on an external machine hosting the agent, which may be located in a different country. This triggers detection mechanisms that rely on location and timezone data.
- Local agents (for example Claude for Chrome) are more difficult to detect because they use the user’s real IP address and metadata (e.g. cookies). However, tools for detecting locally-run, off-the-shelf agents also exist (e.g., cheq.ai). Claude for Chrome still fails tests targeting behavioural metadata unless supplemented with another tool to convincingly simulate these signals.
Custom-made bots
What emerges as a more serious threat is the sophisticated custom bot, such as the “synthetic respondent” described by Westwood (2026). Westwood’s synthetic respondent is a Python programme with access to a LLM that can interact with a survey platform, adopt nuanced personas, and convincingly simulate human behavioural metadata. Westwood tested his bot on a number of research platforms (Conjointly not included) and demonstrated an impressive ability to circumvent standard attention checks and “trolling questions” meant to catch logical inconsistencies it even concealed its true AI identity by deliberately feigning the inability to complete complex tasks that most humans would fail.
This represents the most serious challenge the industry faces. So how do we detect something that has been specifically designed to act human?
Detecting super-bots: the Cognitive Trap Framework
No single countermeasure is likely to be a definitive solution given the continued progress of LLMs, but some, at least for now, look promising. Among them is the Cognitive Trap Framework proposed by Felipe Affonso (2026). The framework relies on a series of cognitive tasks that are easy for humans to complete but difficult for LLMs.
A prime example is a modified version of the well-known Müller-Lyer optical illusion (see the image depicting the original version of the task below).

In the above example, both horizontal lines are the same length, but the “antlers” at the end of each line, facing in opposing directions, create the impression that the blue line is longer.
Below is a modified version of the task where the blue horizontal line is in fact clearly longer than the red one. What happens when we ask an LLM (Google’s Gemini 3.1 Pro) which one is longer?

Advanced LLMs fail these seemingly trivial tasks because they are familiar with the Müller-Lyer illusion and, when presented with a similar-looking stimulus, simply reproduce the learned answer. LLMs fail this task 94% of the time, while humans succeed 93% of the time (Affonso 2026).
(You can find more tasks that explore LLM training data overfitting on the author’s GitHub.)
Searching for bots on Conjointly
The Cognitive Trap Framework, like many similar methods, may prove short-lived as an effective detection tool, but in March 2026 it appeared to be highly effective and straightforward to implement. This is precisely why we decided to apply it in order to estimate the actual prevalence of bots among our own panel suppliers.
We created a survey incorporating the six cognitive tasks proposed by Affonso (all but one – the Shape Overload – because both bots and humans struggled with it). On all chosen tasks, humans tend to perform very well (a 78% to 96% success rate) while bots perform very poorly (a 51% to nearly 100% failure rate). To put this into practice, we deployed this survey to a sample of 200 U.S. participants1.
It is worth noting upfront that failing these tasks does not prove that a respondent is a bot - they may simply be a human who, for whatever reason, wasn’t paying close attention. What the tasks give us is a probabilistic signal, a basis for identifying suspects, not confirming guilt.
With that in mind, we applied Bayes’ Theorem to each respondent’s combined performance across all tasks to estimate the probability of them being a bot. Since Bayes’ Theorem requires prior estimates for the proportion of bots among respondents - something we can only approximate - we ran the analysis under five different priors, ranging from 5% to 25%.
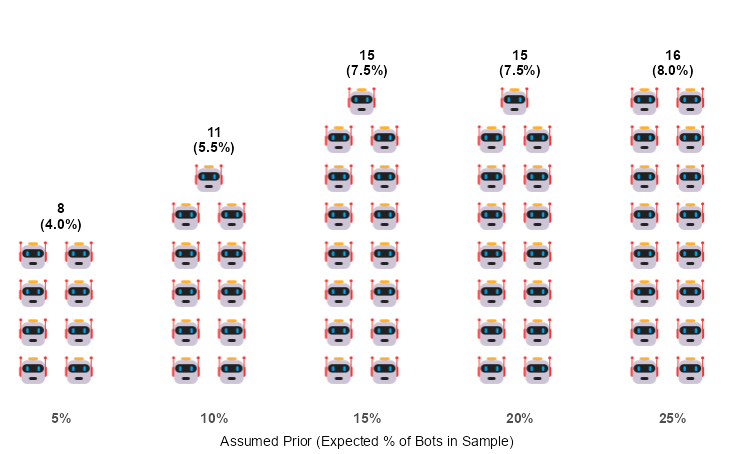
As the chart shows, in the most pessimistic scenario (25% prior), 16 out of 200 respondents failed the tasks with sufficient consistency to yield a greater than 50% probability of being a suspected bot. In the most optimistic scenario (5% prior), 8 respondents were flagged as suspicious. We also observe that the number of suspected bots levels off as the prior increases, which strongly suggests that the true prior is, in fact, below our most pessimistic assumptions. This gives us an estimated prevalence of between 4% and 8%, with the true value likely sitting closer to the lower end of that range.
How can we determine whether, within our group of suspects, we are dealing with bots or humans? We compared the suspects to other members of the panel based on a number of meta-data markers and identified the variables where the discrepancy between the two groups was the most pronounced. What did we learn?
- Bot suspects are predominantly female. This predominance may suggest an organised attempt to fill a specific quota (between 80% and 100%, depending on the prior).
- They move through the survey noticeably faster than average - roughly a minute quicker than non-suspects in a three-minute survey, depending on the prior.
- Their browser language is set to something other than American English.
- There is a timezone mismatch between the respondent’s device and their internet connection.
While most of these signals are consistent with either bot use or fraudulent human respondent, the fast completion times point more toward humans than bots. Firstly, a sophisticated bot - and circumventing all other detection mechanisms on our platform would require sophistication - would be expected to convincingly mimic human behavioural patterns, including survey completion speed. Secondly, speeding humans tend to be much faster than bots - especially ones relying on computer vision.
| Signal | 5% prior | 15% prior | 25% prior | |||
|---|---|---|---|---|---|---|
| Suspects | Others | Suspects | Others | Suspects | Others | |
| Respondents are women | 8/8 (100%) | 95/192 (49%) | 12/15 (80%) | 91/185 (49%) | 13/16 (81%) | 90/184 (49%) |
| Respondents are speeding | 4/8 (50%) | 14/192 (7%) | 6/15 (40%) | 12/185 (6%) | 6/16 (38%) | 12/184 (7%) |
| Browser language not en-US | 1/8 (12%) | 3/192 (2%) | 1/15 (7%) | 3/185 (2%) | 1/16 (6%) | 3/184 (2%) |
| System language not en-US | 3/8 (38%) | 30/192 (16%) | 3/15 (20%) | 30/185 (16%) | 3/16 (19%) | 30/184 (16%) |
| Timezone mismatch | 1/8 (12%) | 12/192 (6%) | 3/15 (20%) | 10/185 (5%) | 3/16 (19%) | 10/184 (5%) |
Could some of the respondents who consistently failed the tasks be bots? Certainly. But, in the end, depending on our priors, we estimate the number of potential bots, after excluding speeders, at no more than 2%–3%. This is a non-trivial figure, particularly in the context of, say, political polling, but a far cry from the most pessimistic assumptions.
In fact, the true number is probably even lower. The circumstantial evidence we gathered, specifically the wide variety of desktop platforms and mobile devices used among the at-risk group, points much more strongly toward inattentive humans rather than AI bots. Bots (particularly organised, large-scale deployments) are much more likely to operate from a uniform environment.
Conclusions
The reality of survey research as it stands today is that we do not appear to be inundated with non-human respondents. Instead, we observe deceptive attempts that bear all the hallmarks of human behaviour, and those, we know how to deal with. That said, our current estimates are based on one sample type, and the picture may look different in higher-stakes contexts: the higher the reward per completed survey, the greater the incentive to cheat. Expensive expert and specialist samples warrant particular attention.
Let’s keep survey research human!
Sources
- Affonso 2026, Brief Commentary: A Framework for Detecting AI Agents in Online Research
- Wang et al 2026, COGNITION: From Evaluation to Defense against Multimodal LLM CAPTCHA Solvers
- Westwood 2026, The potential existential threat of large language models to online survey research
1 We have kept our usual quality checks in place, resulting in the exclusion of 109 respondents for a variety of reasons, such as inattention, egregious speeding, and unfinished surveys. The sample of 200 respondents that we analysed includes only the participants who passed these standard quality checks. ↩