
TURF analysis (Total Unduplicated Reach and Frequency) is a statistical technique that ranks combinations of products by how many people will like these combinations.
TURF Analysis Simulator
Conduct automated TURF analysis on results of any Conjointly experiment (or an outside dataset) using this user-friendly TURF analysis tool.
TURF, or Total Unduplicated Reach and Frequency, is a statistical technique that focuses on the unduplicated reach of a combination of items to evaluate their market potential.
The Conjointly TURF Analysis Simulator is an automated tool that helps you analyse your data from Conjointly experiments or custom data to discover top item combinations that appeal to the most people. It can be used for product claim selection, feature selection, and range optimisation.
Brief history of TURF analysis
Reach and frequency are two interlinked concepts that have been publicised in media planning and advertising dating back to the 1950s. Due to measurement challenges in the early days, reach was primarily represented as the estimated number of people exposed to a media or advertisement, while frequency indicated how often the target audience encountered it.
As media spaces became more competitive and costly in the mid-1970s, the concept of “effective reach and frequency” emerged. Researchers and practitioners concentrated their efforts on developing models to determine optimal levels of reach and frequency to maximise ad effectiveness.
In 1990, Miaoulis et al. presented Total Unduplicated Reach and Frequency (TURF) analysis. This technique, adapted from earlier reach and frequency concepts, aimed to identify the combination of products lines that would attract the highest number of potential consumers. Importantly, TURF analysis shifted the focus of reach from mere number of people exposed to a communication source to the number of people who would like or purchase a product or service.
Since its introduction, TURF analysis has become widely adopted in market research. It’s now used for various applications, including portfolio optimisation, selecting concept combinations for advertising and product launch, and much more.
What is unduplicated reach?
The unduplicated reach of a combination of items is the percentage of individuals who are activated by (or are reached by, prefer, like, hear, etc.) at least one of the items in that combination.
For example, if you consider offering products A and B (but not product C), and know that:
- Sally likes A.
- Billy likes B.
- Zosja likes C.
- Peter likes A.
The unduplicated reach for A+B is 75% (because only Zosja doesn’t like either A or B).
A simple example of TURF analysis
Imagine you are launching a new brand of 🍹 vegetable juices. As you are preparing for the launch, you want to have a range of flavours that will appeal to (“reach”) the largest number of potential customers. But what flavours should you offer if your budget allows only two flavours?
Let’s start by listing all possibilities:
- 🥑 avocado
- 🥕 carrot
- 🥔 potato
- 🌽 corn
- 🌶 pepper
- 🥒 cucumber
- 🥦 broccoli
- 🍄 mushroom
- 🌰 chestnut
What do you do? One way to solve this problem is to run a Product Variant Selector study, which will help you rank flavours by consumer preference. The same study will also give you individual-level preferences, such as:
| Respondent ID | 🥑 | 🥕 | 🥔 | 🌽 | 🌶️ | 🥒 | 🥦 | 🍄 | 🌰 |
|---|---|---|---|---|---|---|---|---|---|
| 1 | 4.9 | 1.5 | 0.6 | -0.8 | 1.2 | 1.8 | 3.9 | -8.5 | 4.0 |
| 2 | 4.5 | 0.8 | -1.3 | 0.1 | -0.2 | 1.7 | 3.8 | -8.4 | 2.0 |
| 3 | 5.5 | -1.0 | 0.3 | -0.3 | 1.4 | 0.7 | 3.6 | -7.3 | 2.9 |
| 4 | 5.7 | -1.2 | -1.0 | 6.0 | 0.0 | 0.1 | 5.2 | -8.9 | 3.1 |
| 5 | 4.3 | -1.5 | -0.3 | -1.5 | -0.8 | 0.8 | 5.9 | -7.8 | 3.7 |
| 6 | 3.2 | 0.8 | -1.0 | -0.2 | 0.2 | 0.2 | 3.7 | -8.5 | 3.5 |
| 7 | 3.1 | 0.2 | 1.2 | -0.2 | -0.9 | 0.5 | 3.1 | -7.5 | 1.5 |
| 8 | 5.1 | 0.5 | -0.1 | -1.4 | -1.4 | 0.3 | 3.1 | -6.5 | 3.8 |
| 9 | 4.6 | 0.9 | -0.9 | -1.4 | 1.0 | 0.1 | 3.4 | -8.0 | 1.2 |
| 10 | 3.2 | 0.9 | 0.5 | -1.0 | 0.4 | 0.3 | 3.6 | -7.8 | 1.7 |
| 11 | 3.4 | -0.5 | -1.4 | 5.0 | 0.2 | 1.5 | 5.8 | -7.9 | 2.2 |
| 12 | 4.8 | -0.9 | 0.5 | 0.3 | -1.0 | 2.9 | 3.0 | -7.2 | 3.7 |
Each cell shows the partworth utility of a certain flavour for a particular respondent. We can then assume that if a particular flavour is among the top two most liked by a person, then we call it appealing to them ✔. Therefore, these scores can be used to identify which flavour will be the most or the second most liked by each respondent:
| Respondent ID | 🥑 | 🥕 | 🥔 | 🌽 | 🌶️ | 🥒 | 🥦 | 🍄 | 🌰 |
|---|---|---|---|---|---|---|---|---|---|
| 1 | ✔ | ✔ | |||||||
| 2 | ✔ | ✔ | |||||||
| 3 | ✔ | ✔ | |||||||
| 4 | ✔ | ✔ | |||||||
| 5 | ✔ | ✔ | |||||||
| 6 | ✔ | ✔ | |||||||
| 7 | ✔ | ✔ | |||||||
| 8 | ✔ | ✔ | |||||||
| 9 | ✔ | ✔ | |||||||
| 10 | ✔ | ✔ | |||||||
| 11 | ✔ | ✔ | |||||||
| 12 | ✔ | ✔ | |||||||
| … | … | … | … | … | … | … | … | … | … |
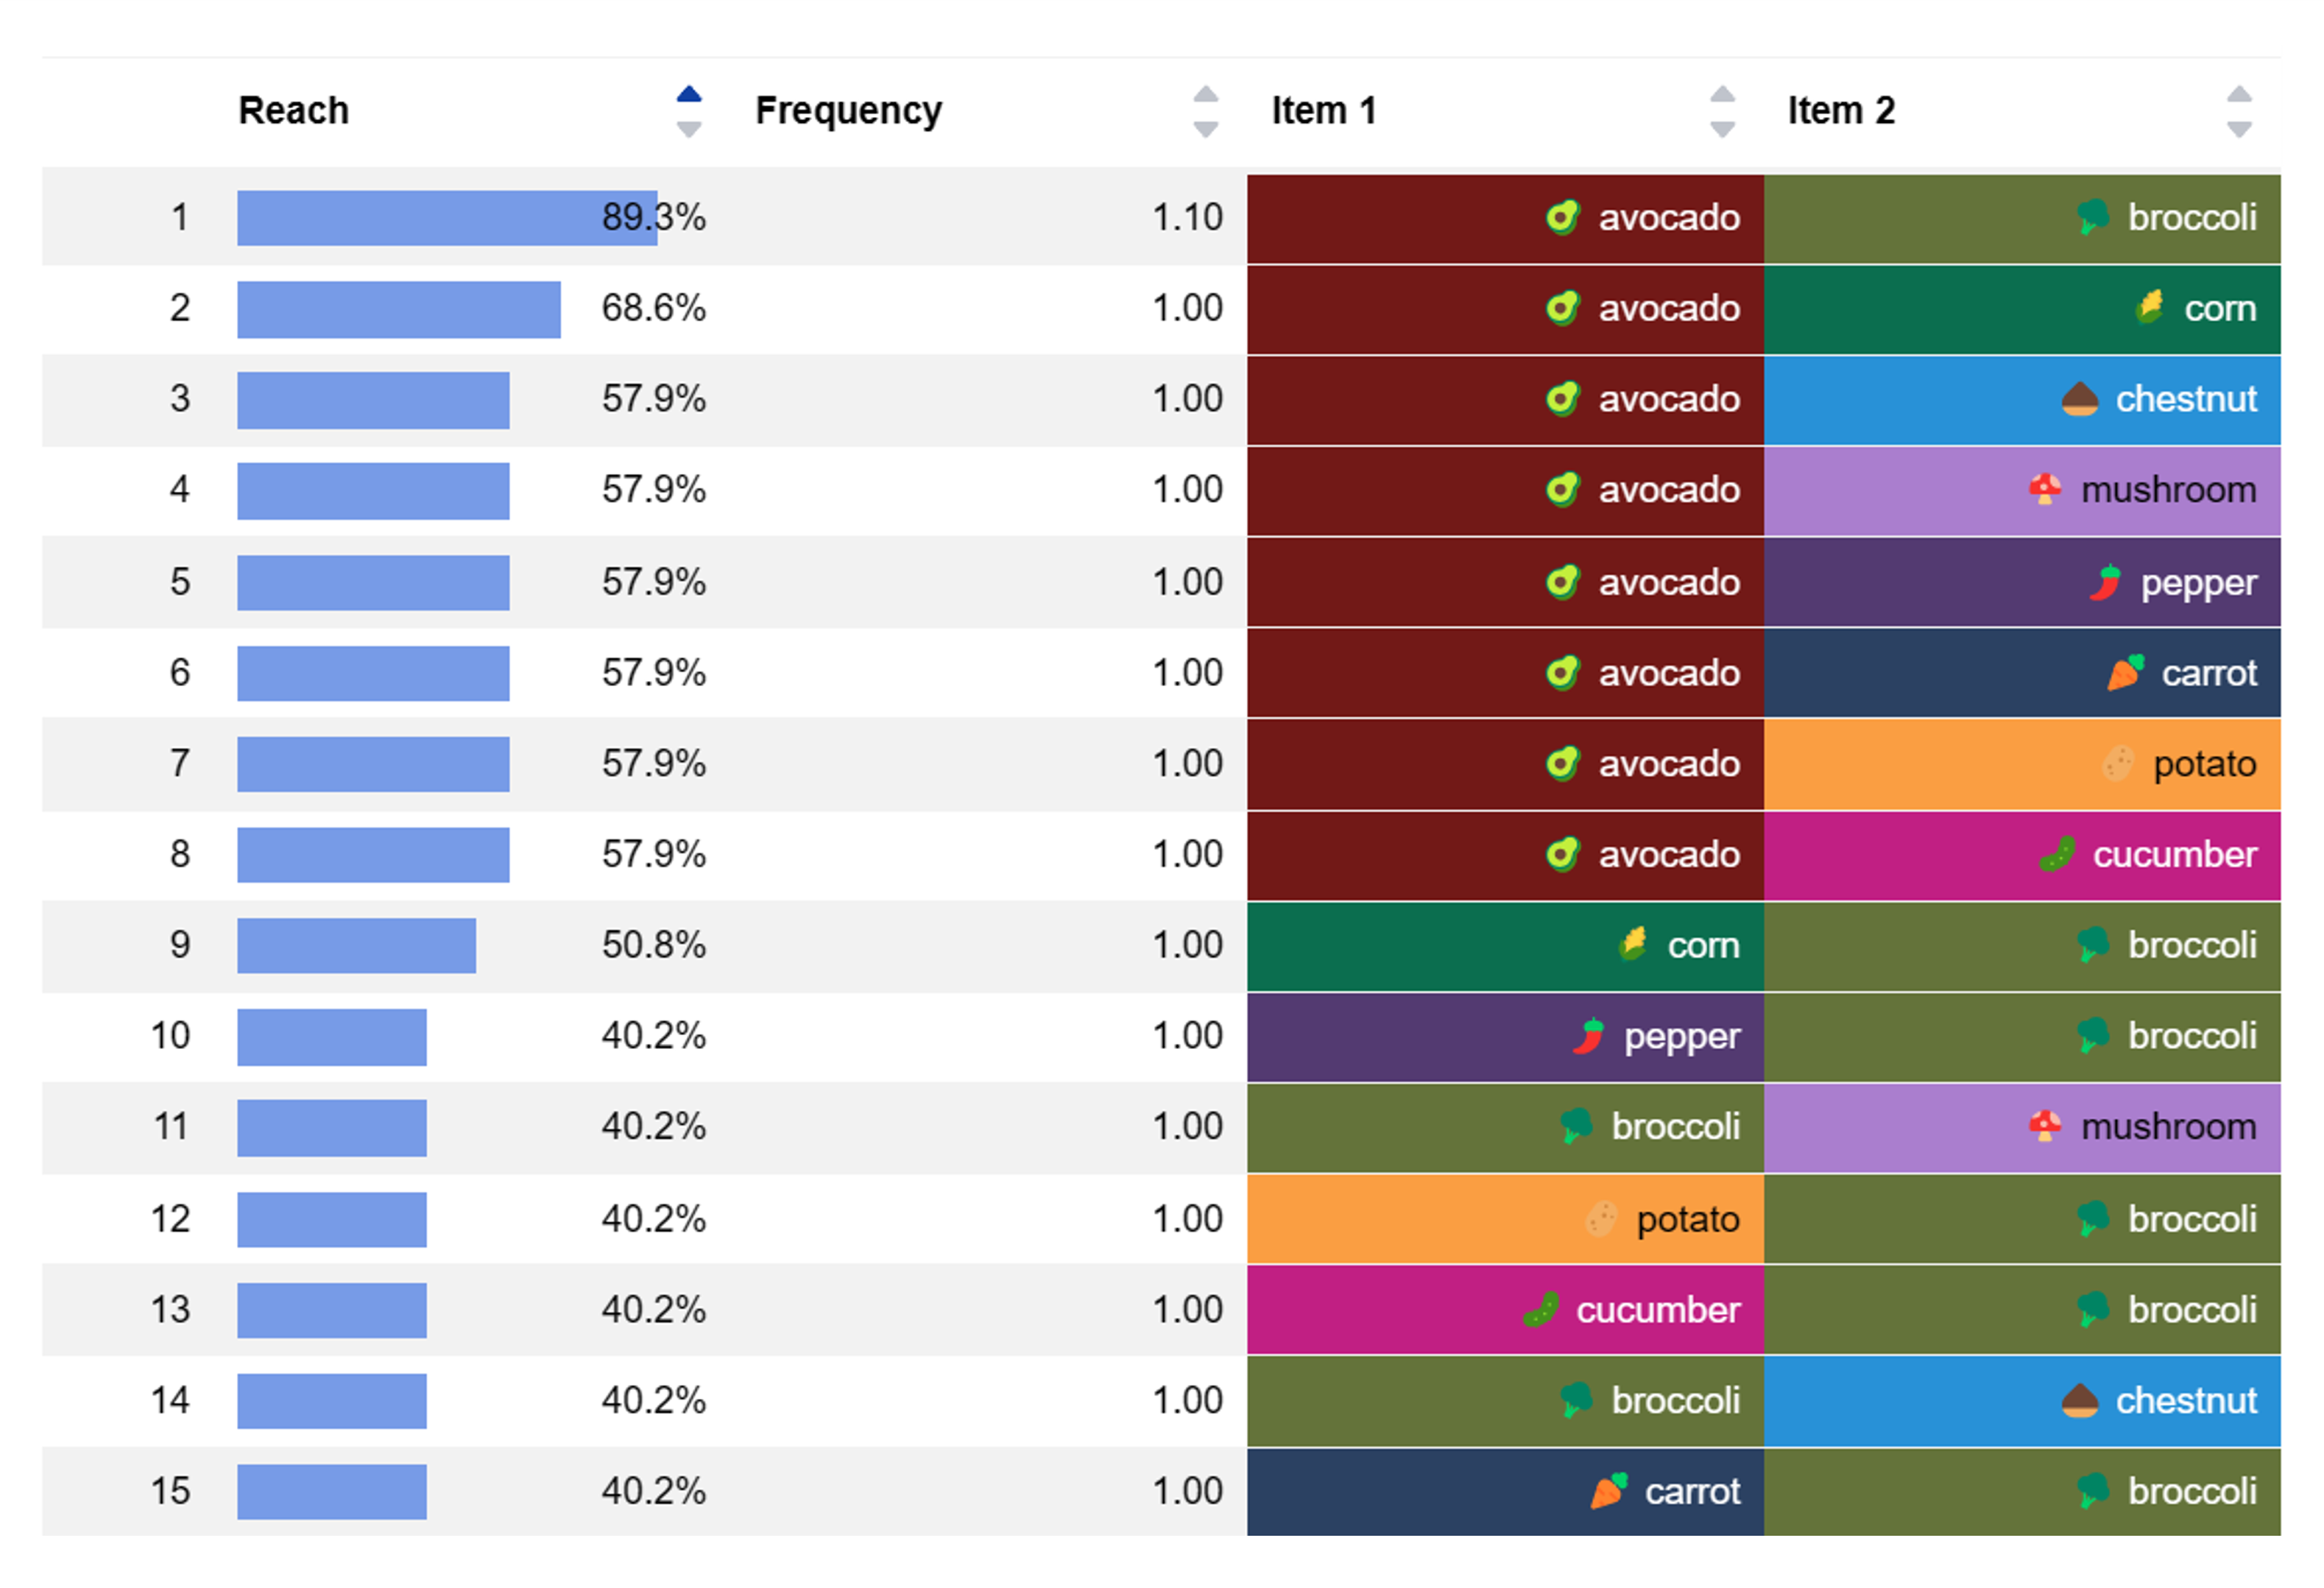
Calculation of unduplicated reach and frequency for two-factor combinations
Next, we assemble several possible combinations of flavours and calculate a couple of metrics:
- (Unduplicated) Reach, the percentage of people for whom at least one of the flavours is appealing.
- Frequency, the average number of appealing flavours per respondent.
| Respondent ID | 🥑 + 🌽 | 🥑 + 🥦 | 🥑 + 🌰 | 🌽 + 🥦 | 🌽 + 🌰 | 🥦 + 🌰 |
|---|---|---|---|---|---|---|
| 1 | ✔ | ✔ | ✔✔ | ✔ | ✔ | |
| 2 | ✔ | ✔✔ | ✔ | ✔ | ✔ | |
| 3 | ✔ | ✔✔ | ✔ | ✔ | ✔ | |
| 4 | ✔✔ | ✔ | ✔ | ✔ | ✔ | |
| 5 | ✔ | ✔✔ | ✔ | ✔ | ✔ | |
| 6 | ✔ | ✔ | ✔ | ✔ | ✔✔ | |
| 7 | ✔ | ✔✔ | ✔ | ✔ | ✔ | |
| 8 | ✔ | ✔ | ✔✔ | ✔ | ✔ | |
| 9 | ✔ | ✔✔ | ✔ | ✔ | ✔ | |
| 10 | ✔ | ✔✔ | ✔ | ✔ | ✔ | |
| 11 | ✔ | ✔ | ✔✔ | ✔ | ✔ | |
| 12 | ✔ | ✔ | ✔✔ | ✔ | ✔ | |
| … | … | … | … | … | … | … |
| Reach | 11 | 12 | 11 | 9 | 6 | 11 |
| Reach % | 92% | 100% | 92% | 75% | 50% | 92% |
| Frequency | 1.1 | 1.5 | 1.3 | 1.1 | 1.0 | 1.1 |
As you see, everyone likes at least one of 🥑 avocado + 🥦 broccoli (Reach = 100%). This combination is a winner!
Calculation of unduplicated reach and frequency for three-factor combinations
If you have more budget to launch three combinations, you can do the same analysis with three-way combinations:
| Respondent ID | 🥑 + 🌽 + 🥦 | 🥑 + 🌽 + 🌰 | 🥑 + 🥦 + 🌰 | 🌽 + 🥦 + 🌰 |
|---|---|---|---|---|
| 1 | ✔ | ✔✔ | ✔✔ | ✔ |
| 2 | ✔✔ | ✔ | ✔✔ | ✔ |
| 3 | ✔✔ | ✔ | ✔✔ | ✔ |
| 4 | ✔✔ | ✔✔ | ✔ | ✔ |
| 5 | ✔✔ | ✔ | ✔✔ | ✔ |
| 6 | ✔ | ✔ | ✔✔ | ✔✔ |
| 7 | ✔✔ | ✔ | ✔✔ | ✔ |
| 8 | ✔ | ✔✔ | ✔✔ | ✔ |
| 9 | ✔✔ | ✔ | ✔✔ | ✔ |
| 10 | ✔✔ | ✔ | ✔✔ | ✔ |
| 11 | ✔✔ | ✔ | ✔ | ✔✔ |
| 12 | ✔ | ✔✔ | ✔✔ | ✔ |
| … | … | … | … | |
| Reach | 12 | 12 | 12 | 12 |
| Reach % | 100% | 100% | 100% | 100% |
| Frequency | 1.7 | 1.3 | 1.8 | 1.2 |
This time, all combinations have equally good reach. Now you need to look at frequency. If you offer the combination of 🥑 avocado + 🥦 broccoli + 🌰 chestnut, for an average consumer, there will 1.8 liked flavours from your brand. This is the way to go.
Deciding number of SKUs to launch through TURF
TURF analysis can be used to determine an efficient number of SKUs to launch for your range. For example, based on your internal finance calculations, you can determine that you must sell at least 100,000 items for any single SKU to recoup advertising investment, and that you generally want to have only a handful of SKUs to avoid destocking by your retail channels.
Say, your total market is 2 million units a year, and you can sell 1 unit per consumer a year. That means that any new SKU must reach 5% of the market.
Now, we need to model a few scenarios:
- What is the reach if you only launch 1 SKU with the best potential?
- What is the reach of the additional SKU if you only launch 2 SKU with the best potential?
- What is the reach of the third SKU if you launch 3 SKU with the best potential?
- What is the reach of the fourth SKU if you launch 4 SKU with the best potential?
- And so on.
This type of analysis is call the TURF ladder:

In this example, it is efficient to launch six SKUs because the additional share of the seventh SKU is below 5%. Adding it means you will not recoup advertising investment.
This analysis is most helpful for most FMCG/CPG situations because:
- Companies have fixed costs for produce and promote an SKU
- Companies generally favour lower complexity (i.e. a minimum number of SKUs in the range)
You can also use TURF analysis to address these research questions.
What is the difference between TURF and conjoint analysis?
Conjoint analysis is both a way of asking questions and an analytical framework, while TURF analysis is a type of calculation that runs on previously collected data.
Conjoint data can be used in TURF analysis, but only to analyse combinations of levels within a specific attribute. For example, if you had an attribute of flavours with levels like sweet, sour, and tangy, TURF can help you find two flavours that will cater to most of the market. Although you can do similar analysis through preference share simulations, it will take into account all attributes, not just one attribute.
Conjoint analysis, especially when combined with simulations, is more versatile than TURF and can be used to analyse mixing features in a single product (i.e. combinations of levels that go well together, not combinations that will appeal to different people).
Learn more about the differences between conjoint preference shares and TURF analysis.
FAQs
What are the limitations of using TURF analysis for range optimisation?
TURF is commonly performed on a set of your own flavours, SKUs, or product variants. If you do not also consider your competition, this could result in optimisation for your range only.
There are two ways to avoid this pitfall:
- Consider including competitor SKUs into your list of items. You can then run TURF analysis with the constraint of always including competitor ranges and mainly look at the total reach of your own product set.
- Consider only surveying your loyal buyers. This way, you will have a sample who are unlikely to easily switch to competitor products.
What if my TURF reach percentages are very low?
If you see low reach percentages for top combinations, it means that respondents’ preferences are non-homogeneous. That is, different respondents like different things.
For example, if the best two-way combination of items reaches only 10% of sample, it implies that the other 90% of sample like something else and there is not a clear winning combination.
Generally, the greater the number of items in the test, the lower the TURF reach percentage. However, what level of low threshold to use depends on your objectives.
How do I do TURF analysis in Excel?
Excel by itself is not set up to run complex analyses like TURF, but you do have options:
- Use the user-friendly Conjointly TURF Analysis Simulator and export results with nice formatting into Excel.
- Use an R package together with an Excel-R connector (such as BERT).
- Buy and install a specialised TURF package for Excel.