Conjointly surveyed 712 US adults, including both active and potential sports bettors, to uncover detailed insights about platform preferences, betting behaviours, and responses to different promotional strategies.
The US sports betting landscape has transformed dramatically since the 2018 Supreme Court decision allowing states to legalise sports betting. For sports fans, exposure to betting content has become virtually unavoidable, with gambling advertisements saturating live games and the biggest names in sports regularly appearing in promotional campaigns.
Travis Kelce loves LeBron's DraftKings commercial 😂 @newheightshow pic.twitter.com/UAbgRIKDZy
— DraftKings (@DraftKings) January 30, 2025
As sports betting platforms compete intensely for market share and new states continue to legalise betting, understanding how bettors select and engage with betting platforms has become crucial for success in this rapidly evolving industry.
To provide these insights, Conjointly surveyed 712 US adults from January 18 to February 5, 2025. This study explores platform awareness and usage, betting patterns, advertising impact, and the features that matter most to users when choosing where to place their bets.
The study surveyed respondents across two key segments: active sports bettors who had placed wagers in the past 12 months (80%) and potential sports bettors who expressed likelihood to participate in the coming year (20%). Results were weighted to align with US population distributions across age and gender demographics.
Sports viewing and betting behaviours
Sports viewership and betting
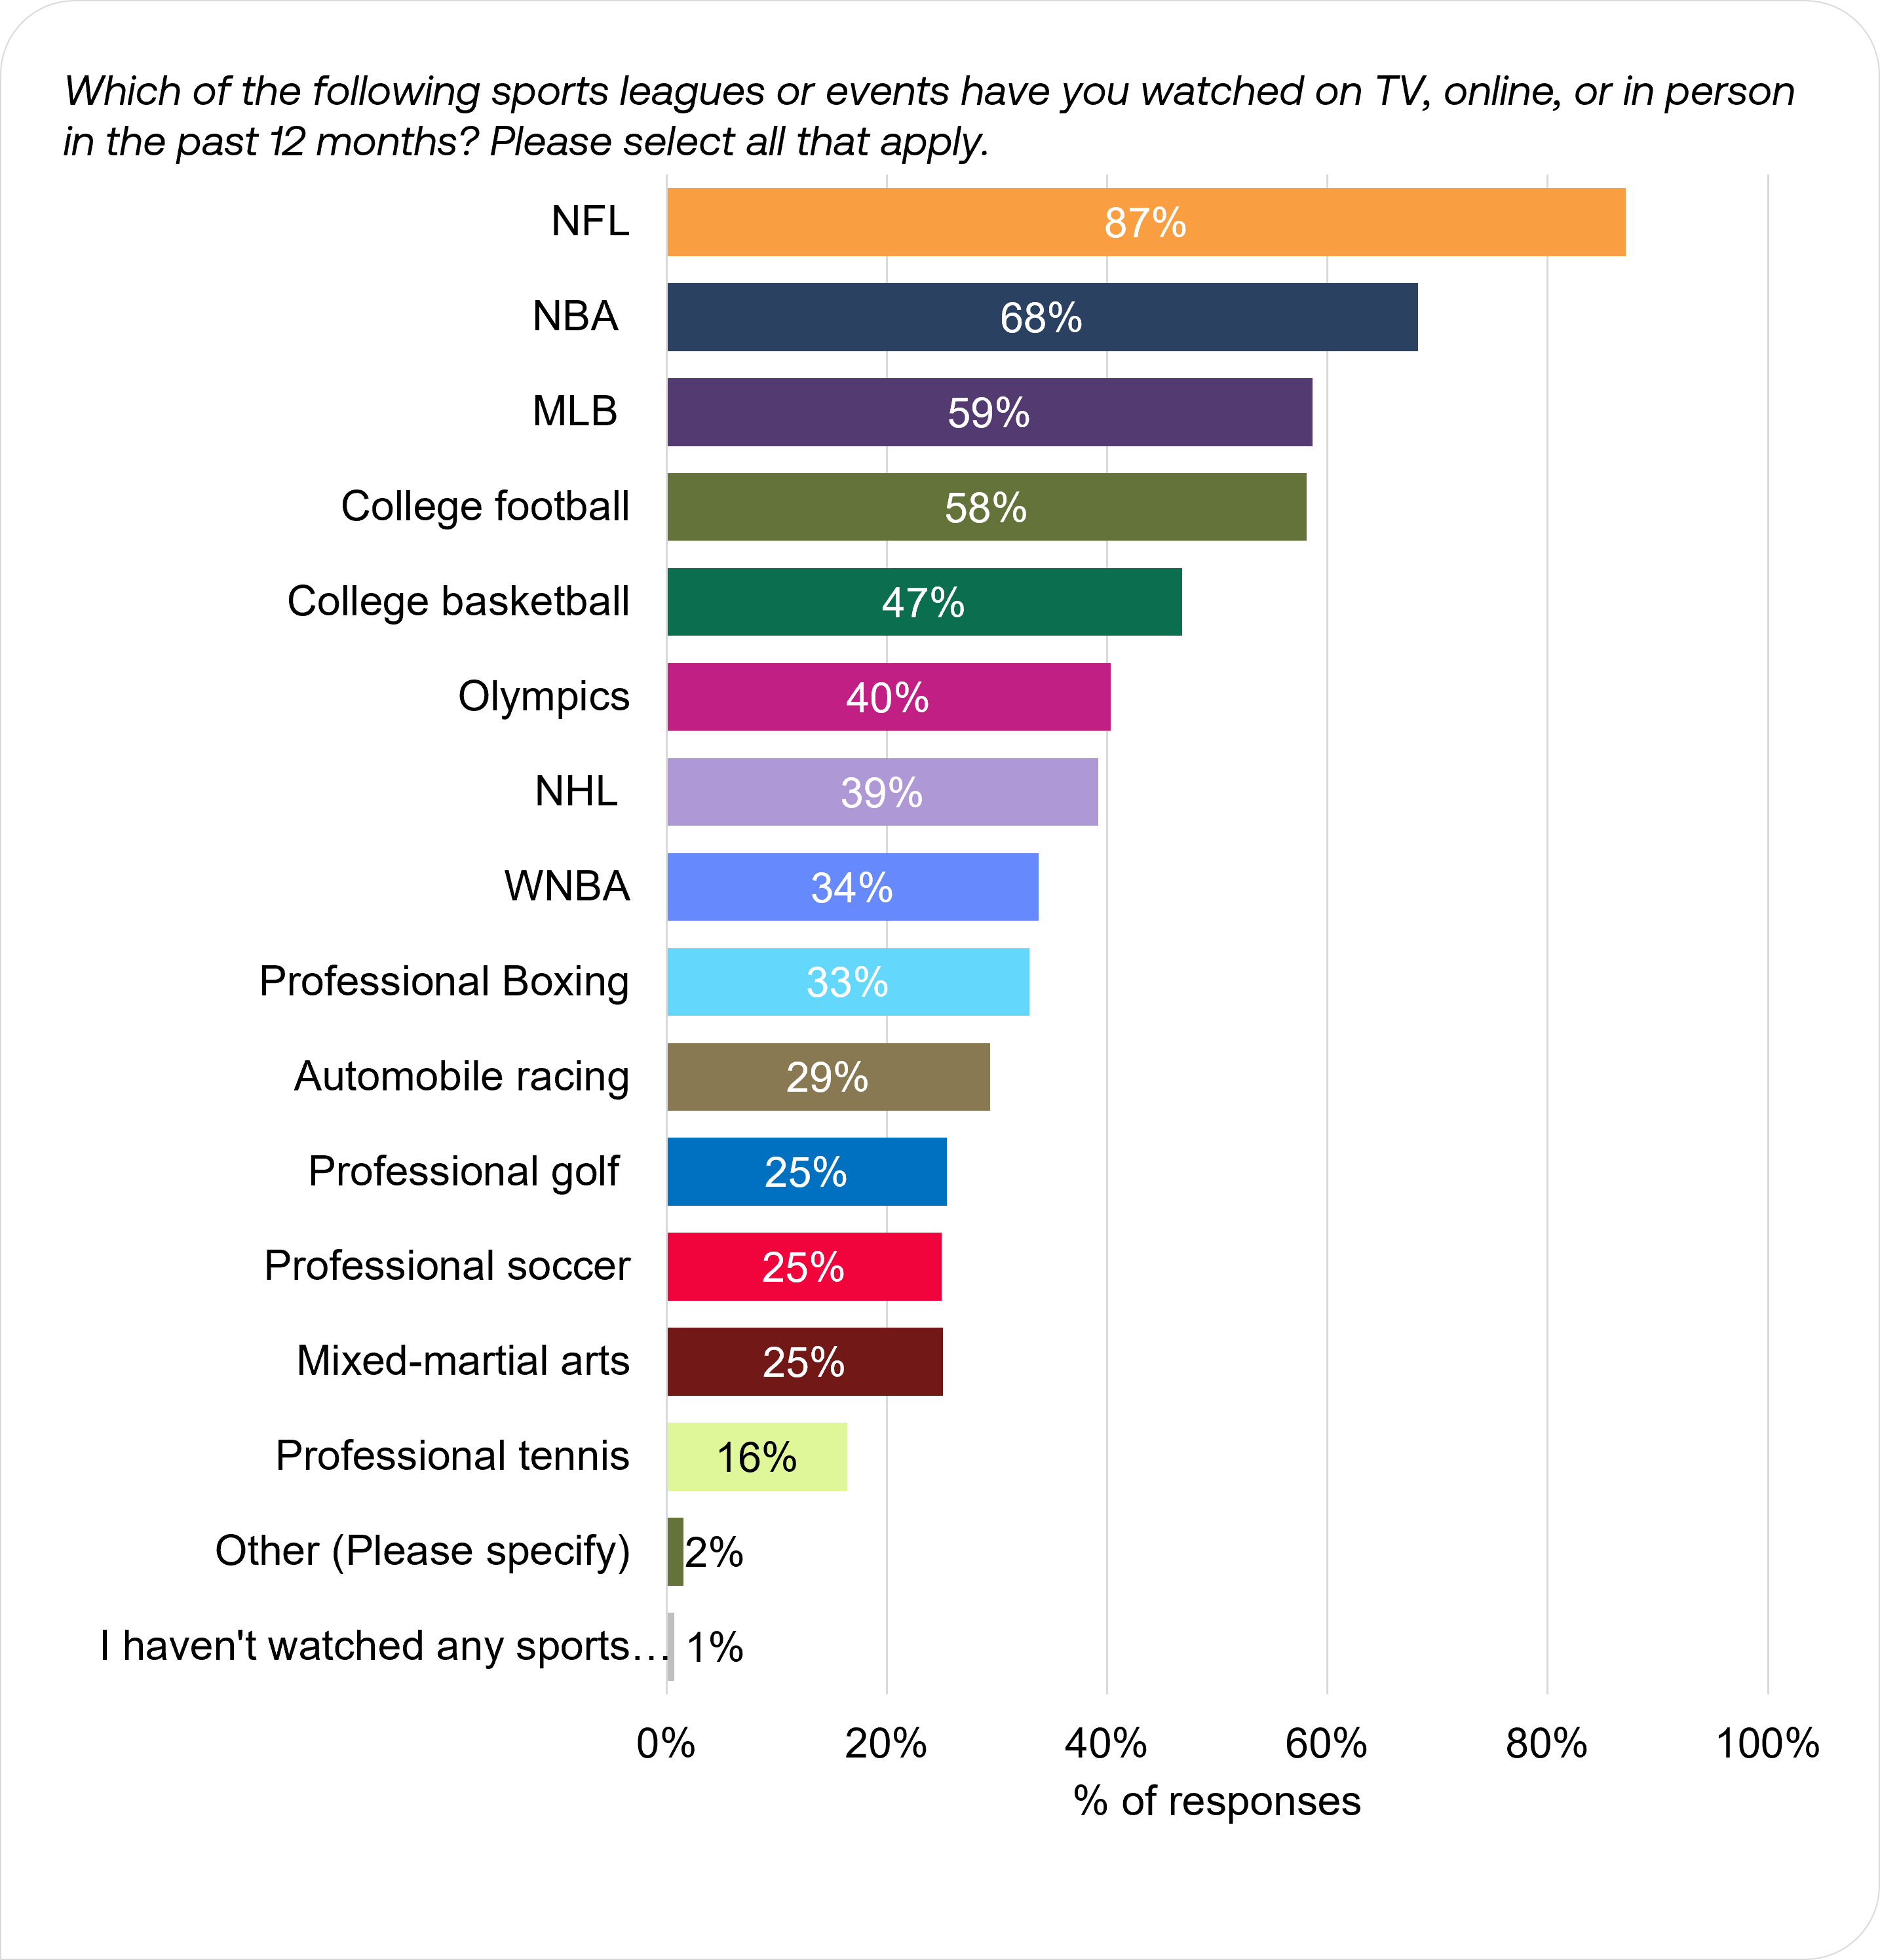
The NFL commands the highest engagement across all sports, reaching 87% viewership among respondents, followed by the NBA at 68% and the MLB at 59%. Beyond these top three sports, college sports and the Olympics drew viewership above 40%, with college football at 58%, college basketball at 47% and Olympics at 40%.
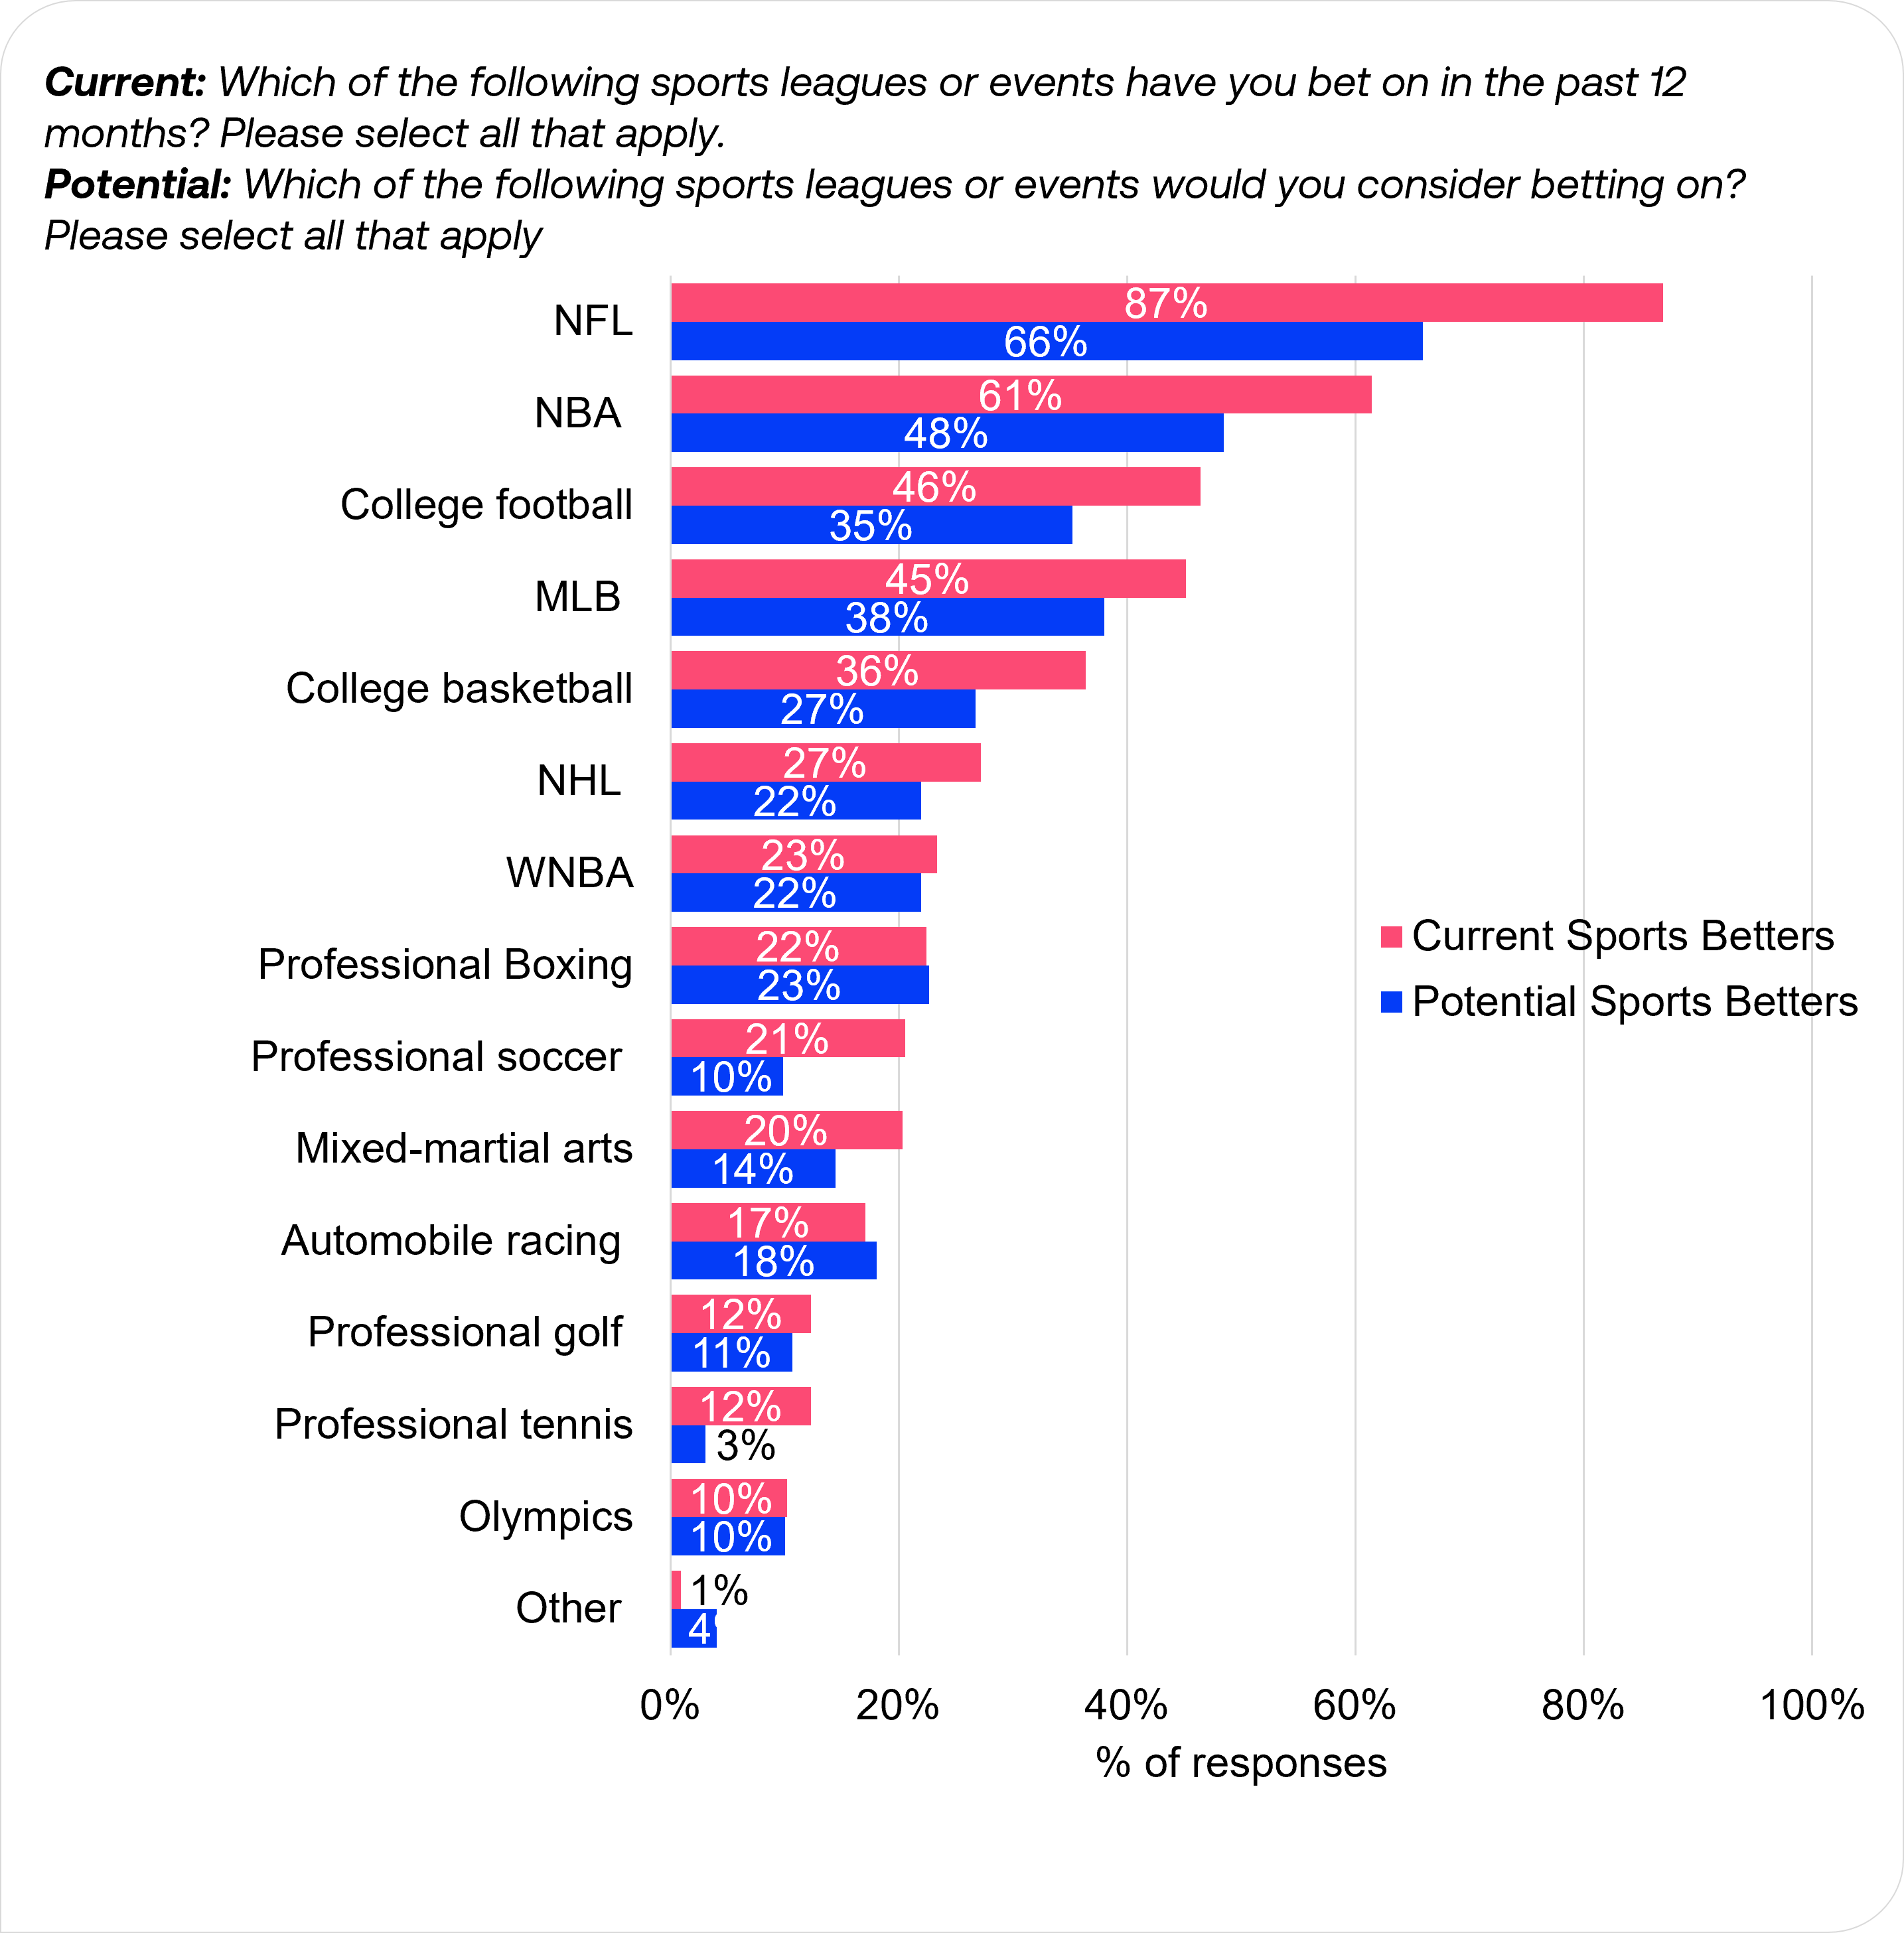
Betting patterns largely mirror viewing habits, particularly for major leagues. The NFL dominates both current and potential betting interest, with 87% of active bettors placing NFL wagers and 66% of potential bettors considering it. The NBA holds second place for both groups (61% current, 48% potential). College football (46% current, 35% potential) and MLB (45% current, 38% potential) show similar engagement levels.
While potential bettors show overall lower percentages across sports, professional boxing (22% current vs 23% potential), automobile racing (17% current vs 18% potential), and other sports (1% current vs 4% potential) show slightly higher interest among potential bettors. This suggests possible growth opportunities in these categories as the betting market expands.
Preferred betting channels
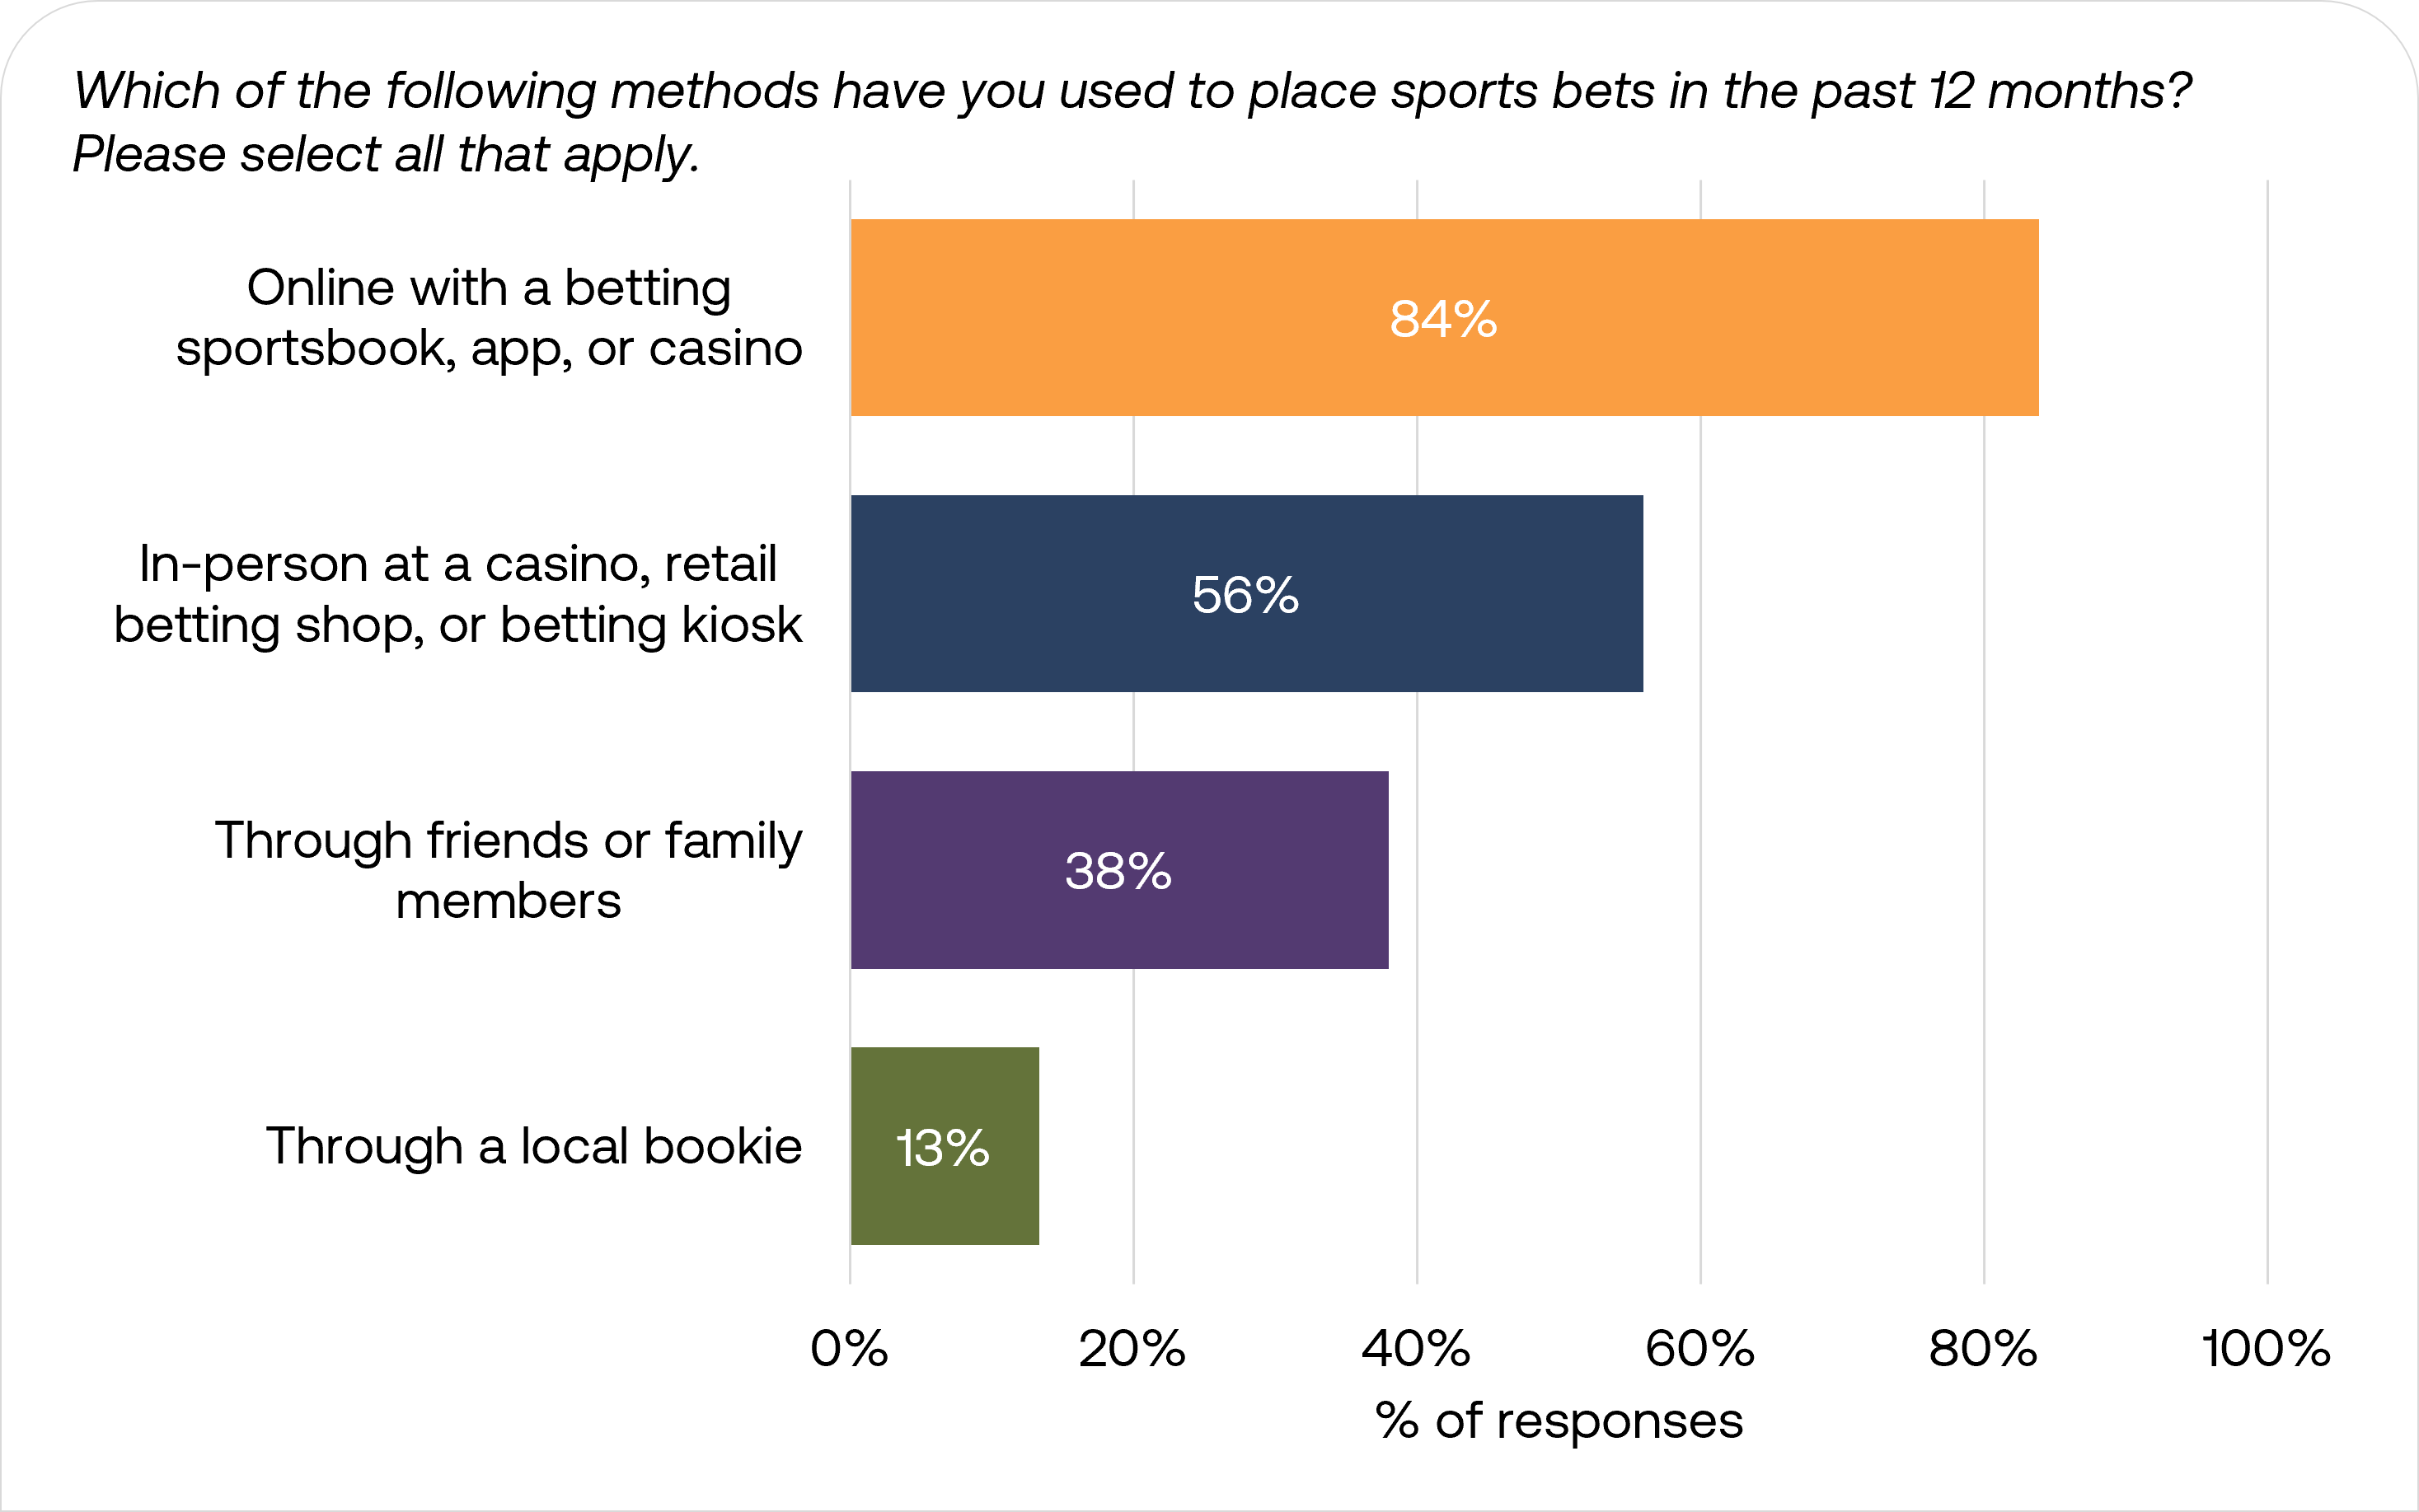
Among active bettors, digital platforms have emerged as the preferred betting method, with 84% placing wagers online within the past 12 months. In-person betting ranked second at 56%, while social betting also plays a significant role, with 38% reporting betting activities with friends or family.
Betting frequency and spend
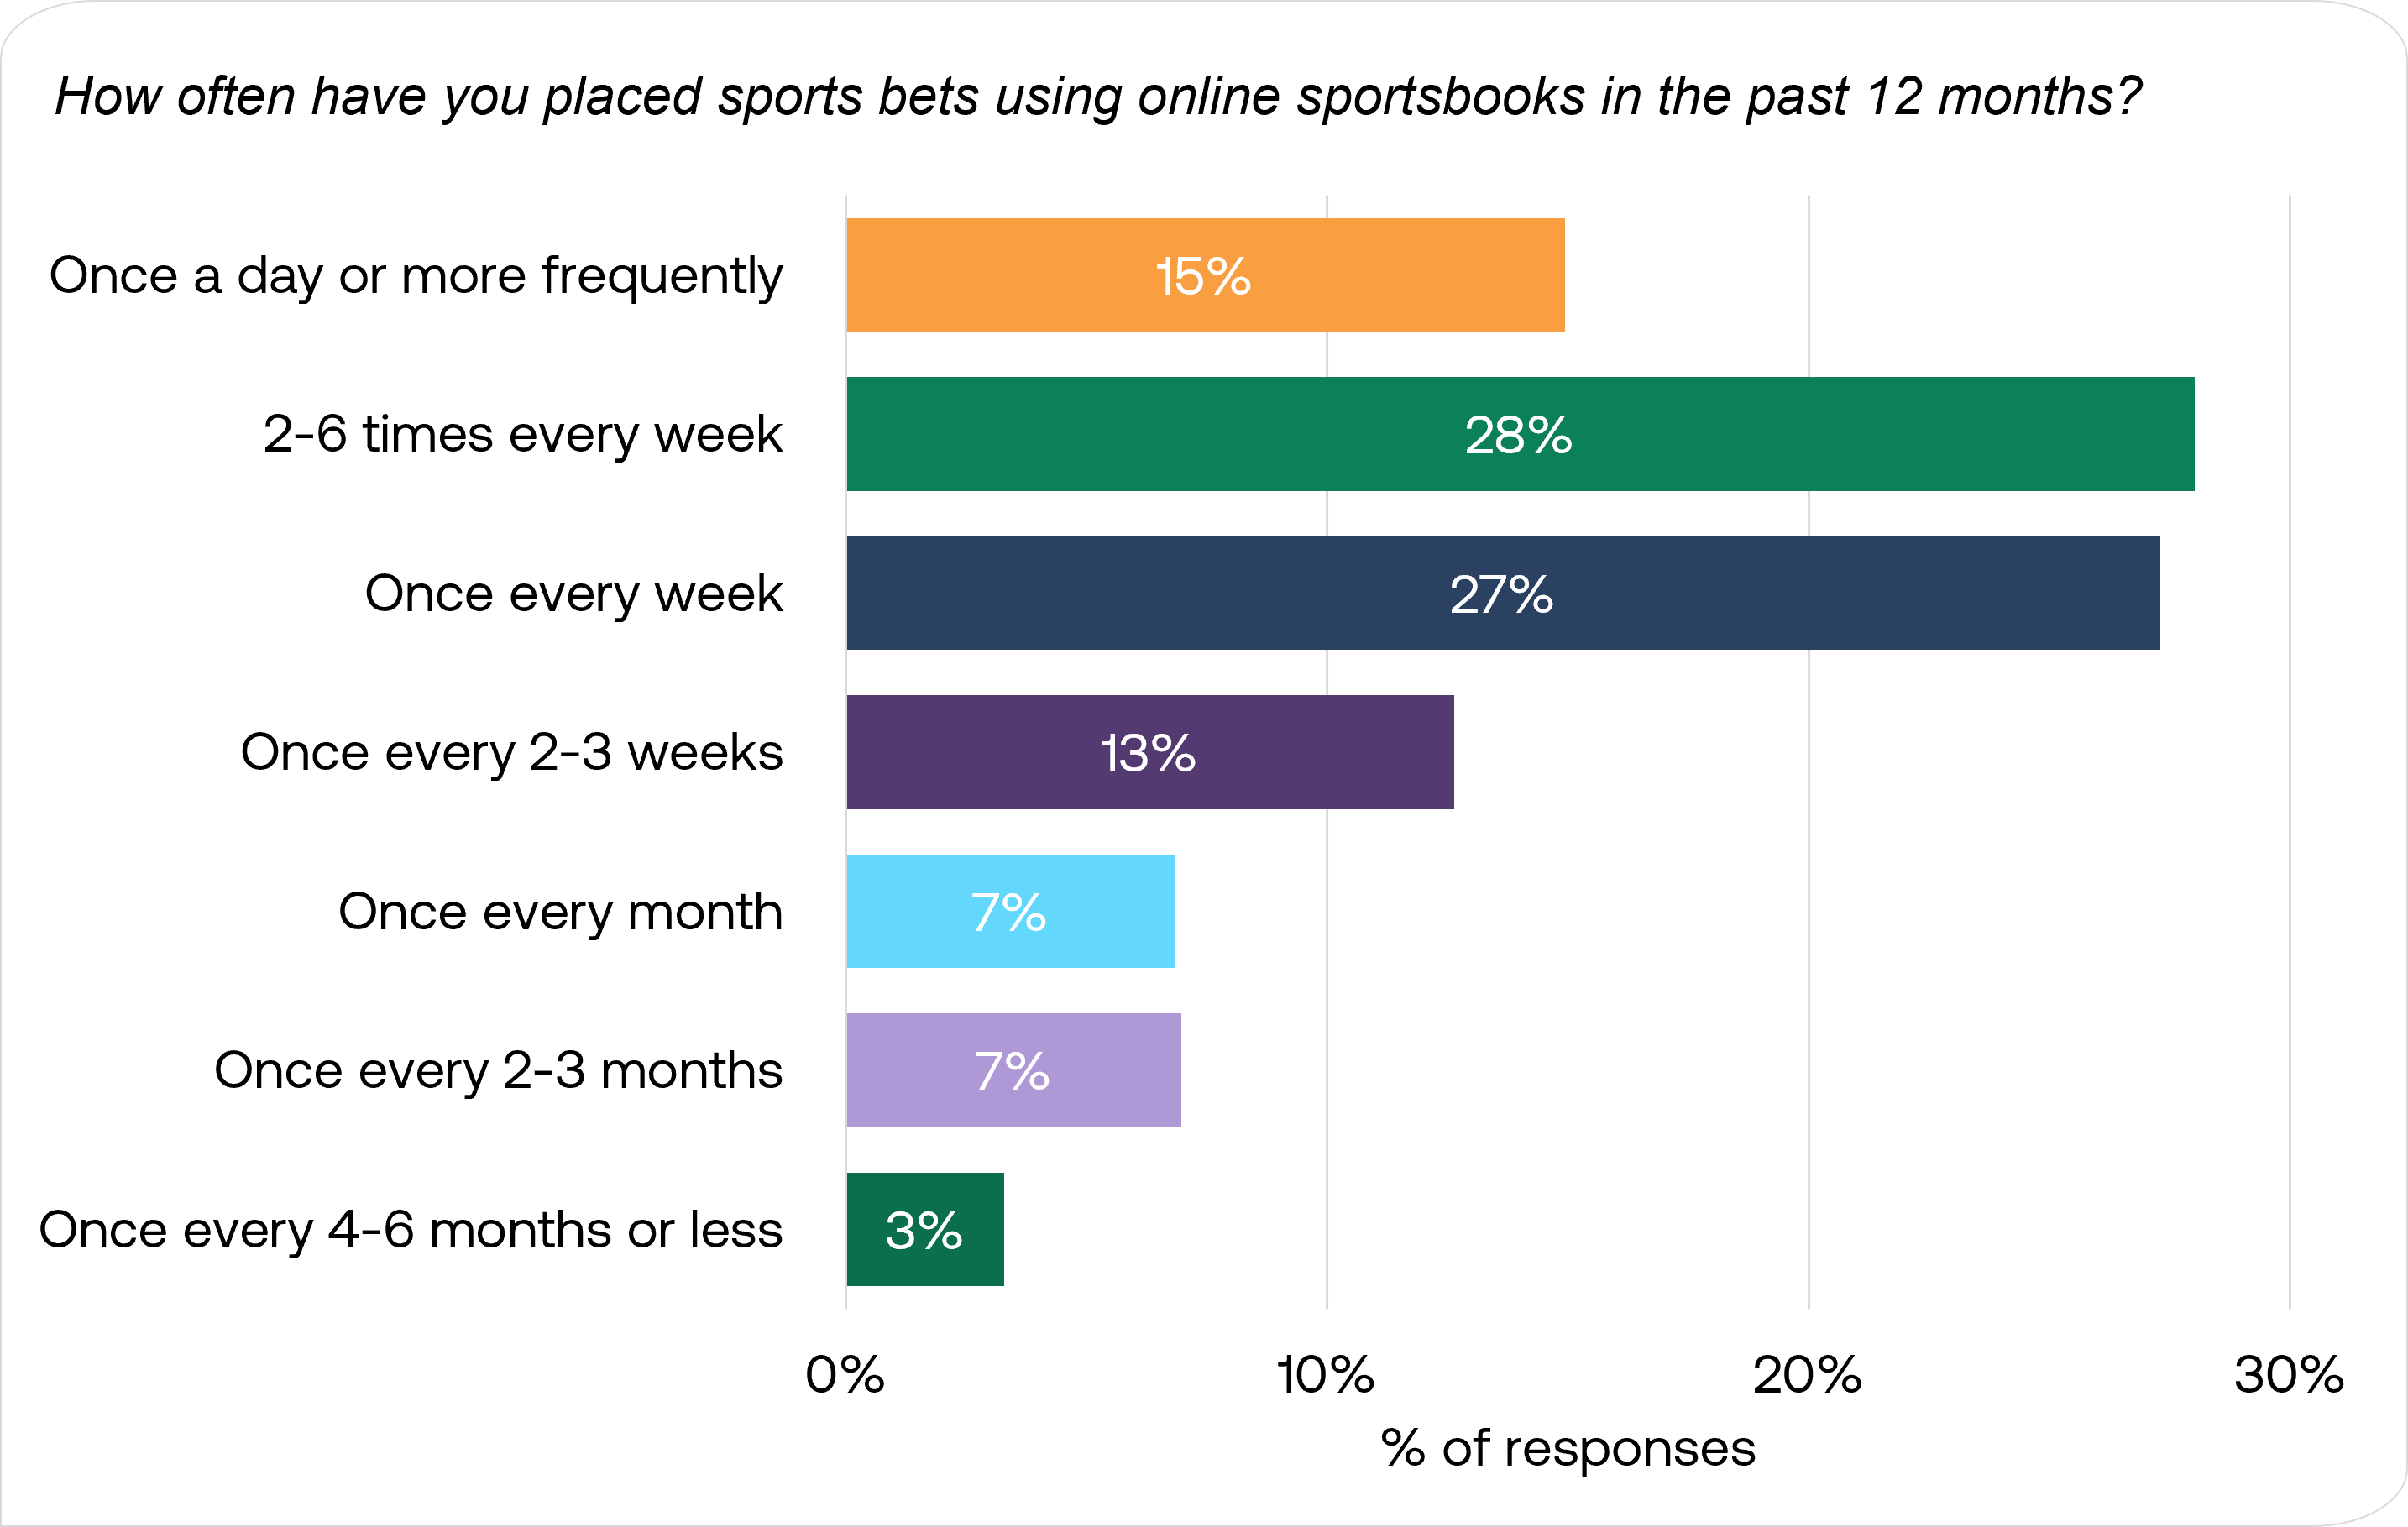
Online sports betting has become a regular activity for most participants, with seven in ten bettors placing wagers at least weekly, including 28% betting multiple times per week and 15% betting daily. Weekly bettors make up 27% of respondents, while those wagering monthly or less frequently account for just 17% of respondents.
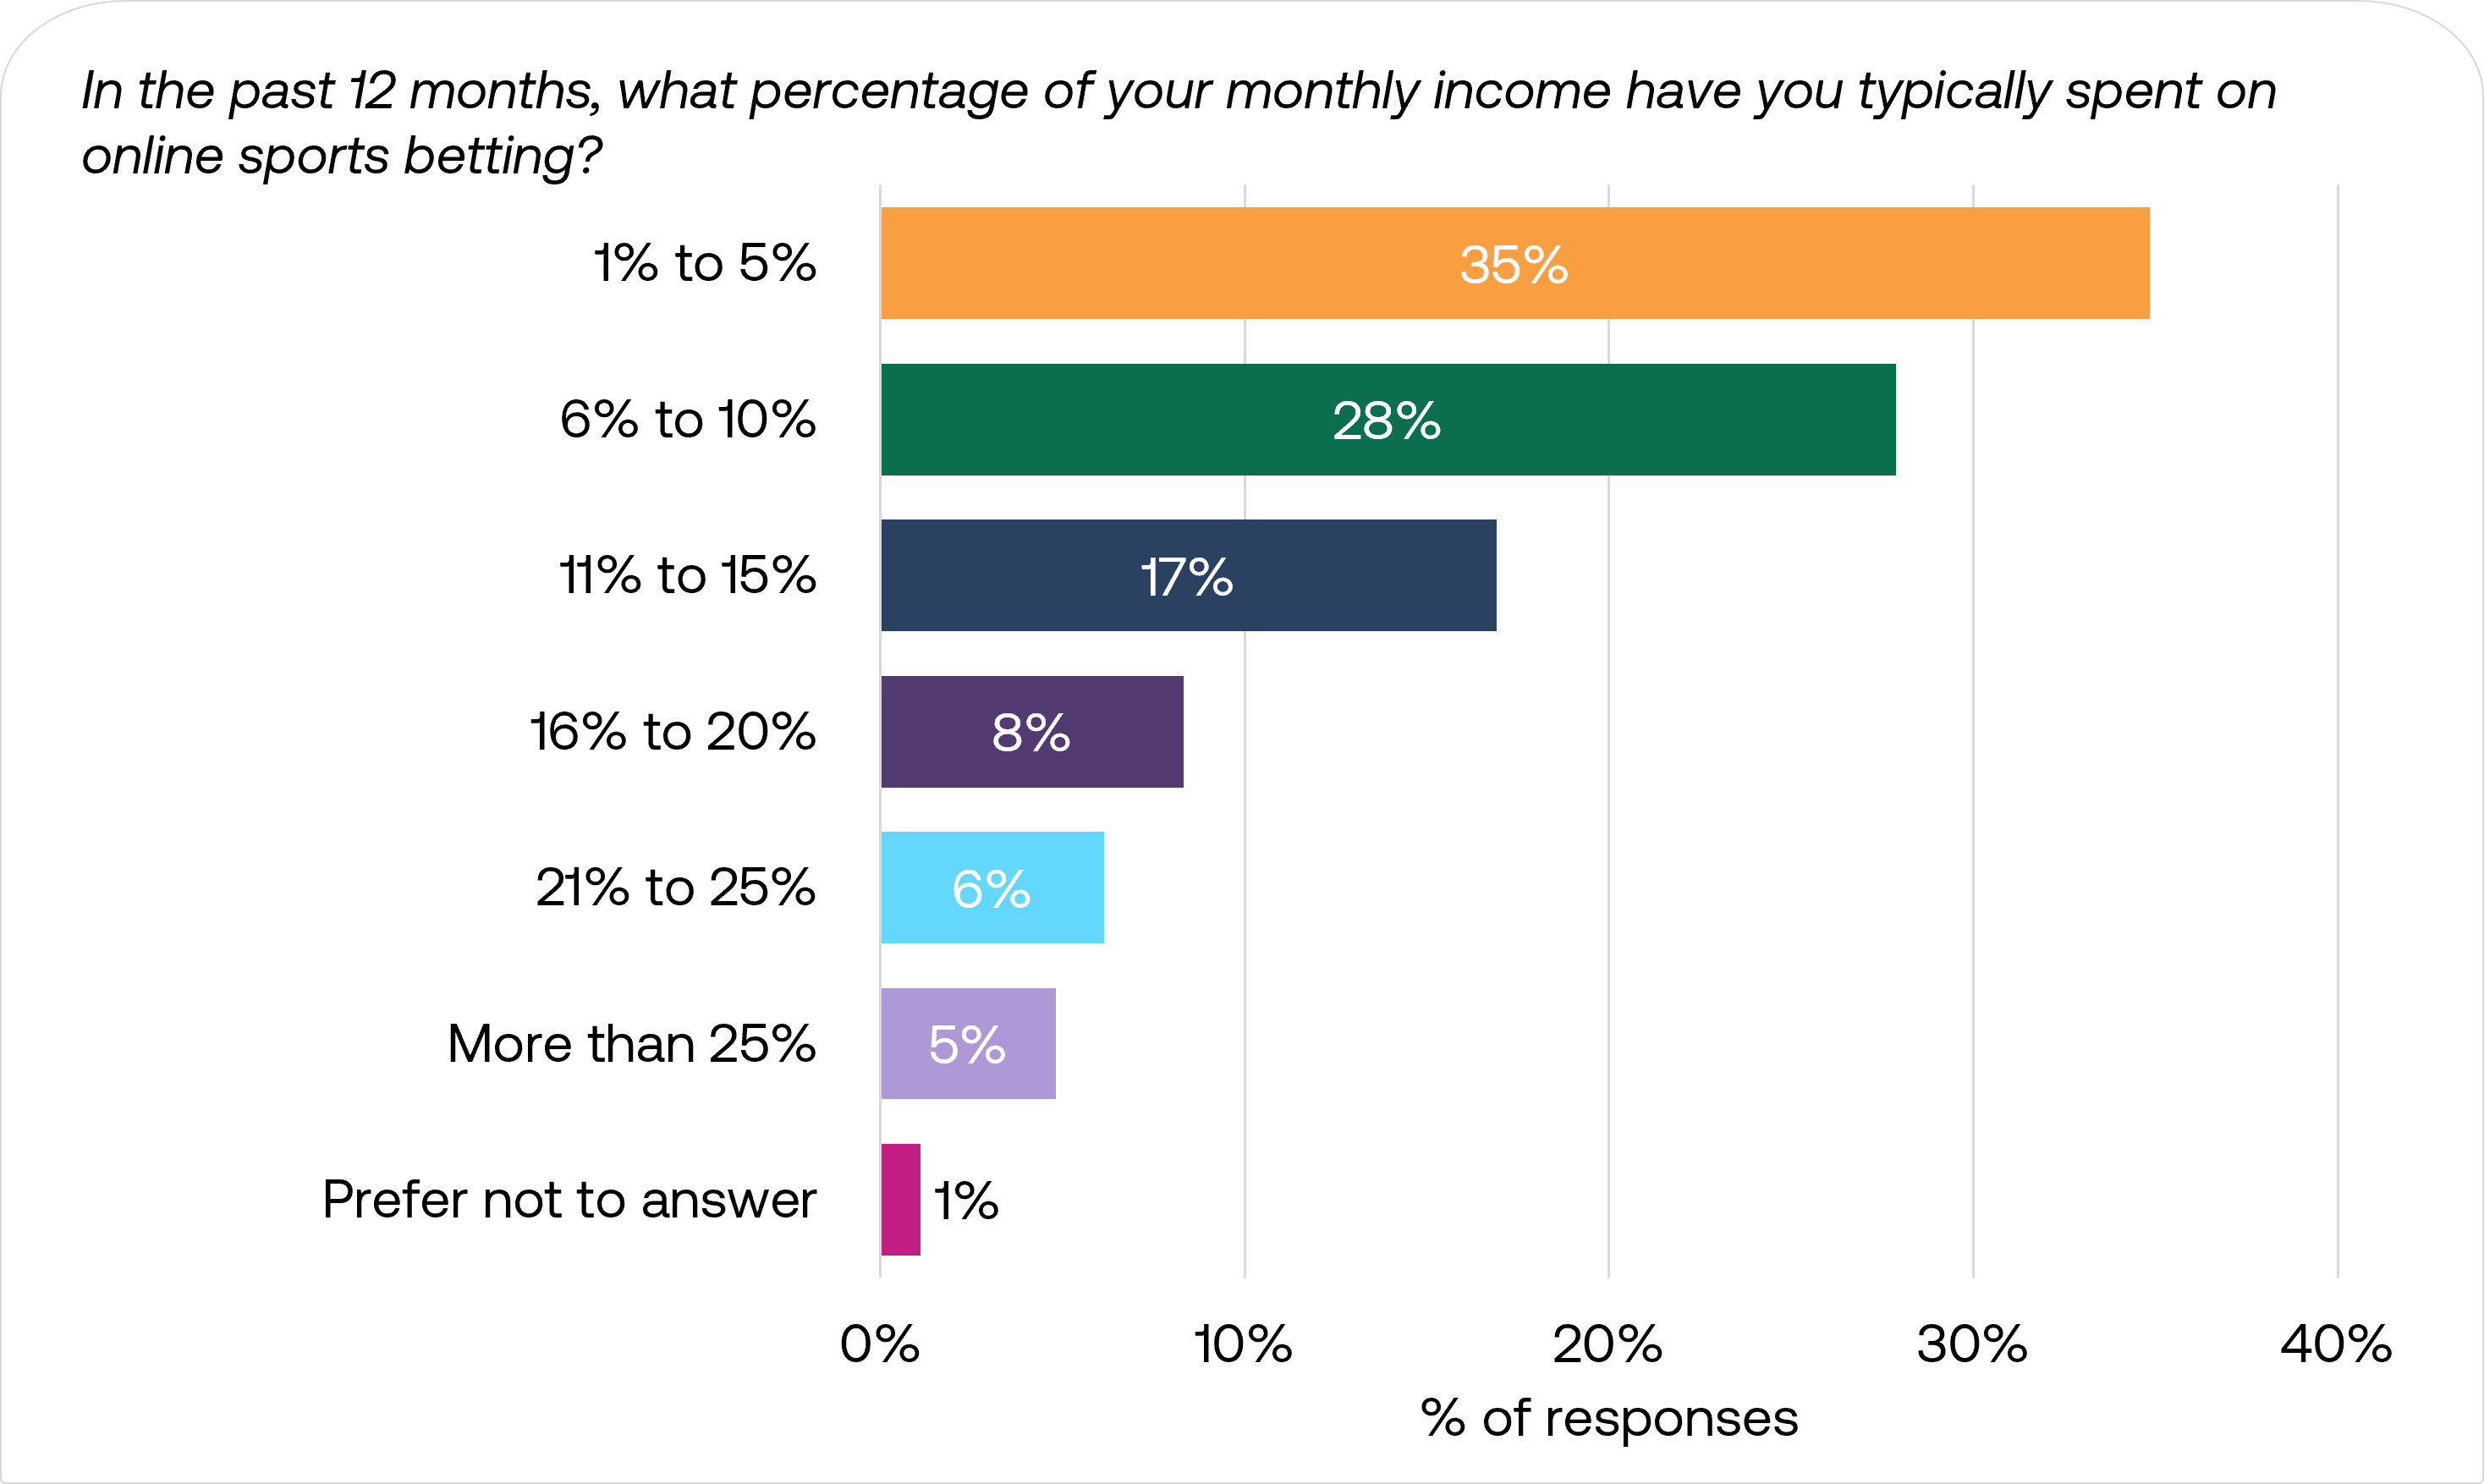
63% of bettors allocate 10% or less of their monthly income to sports betting, with 35% spending between 1-5% of their monthly income and 28% spending 6-10%. A considerable number of respondents bet more heavily, with 17% spending 11-15% and 19% spending over 15% of their monthly income on sports betting.
Betting motivation and performance perceptions
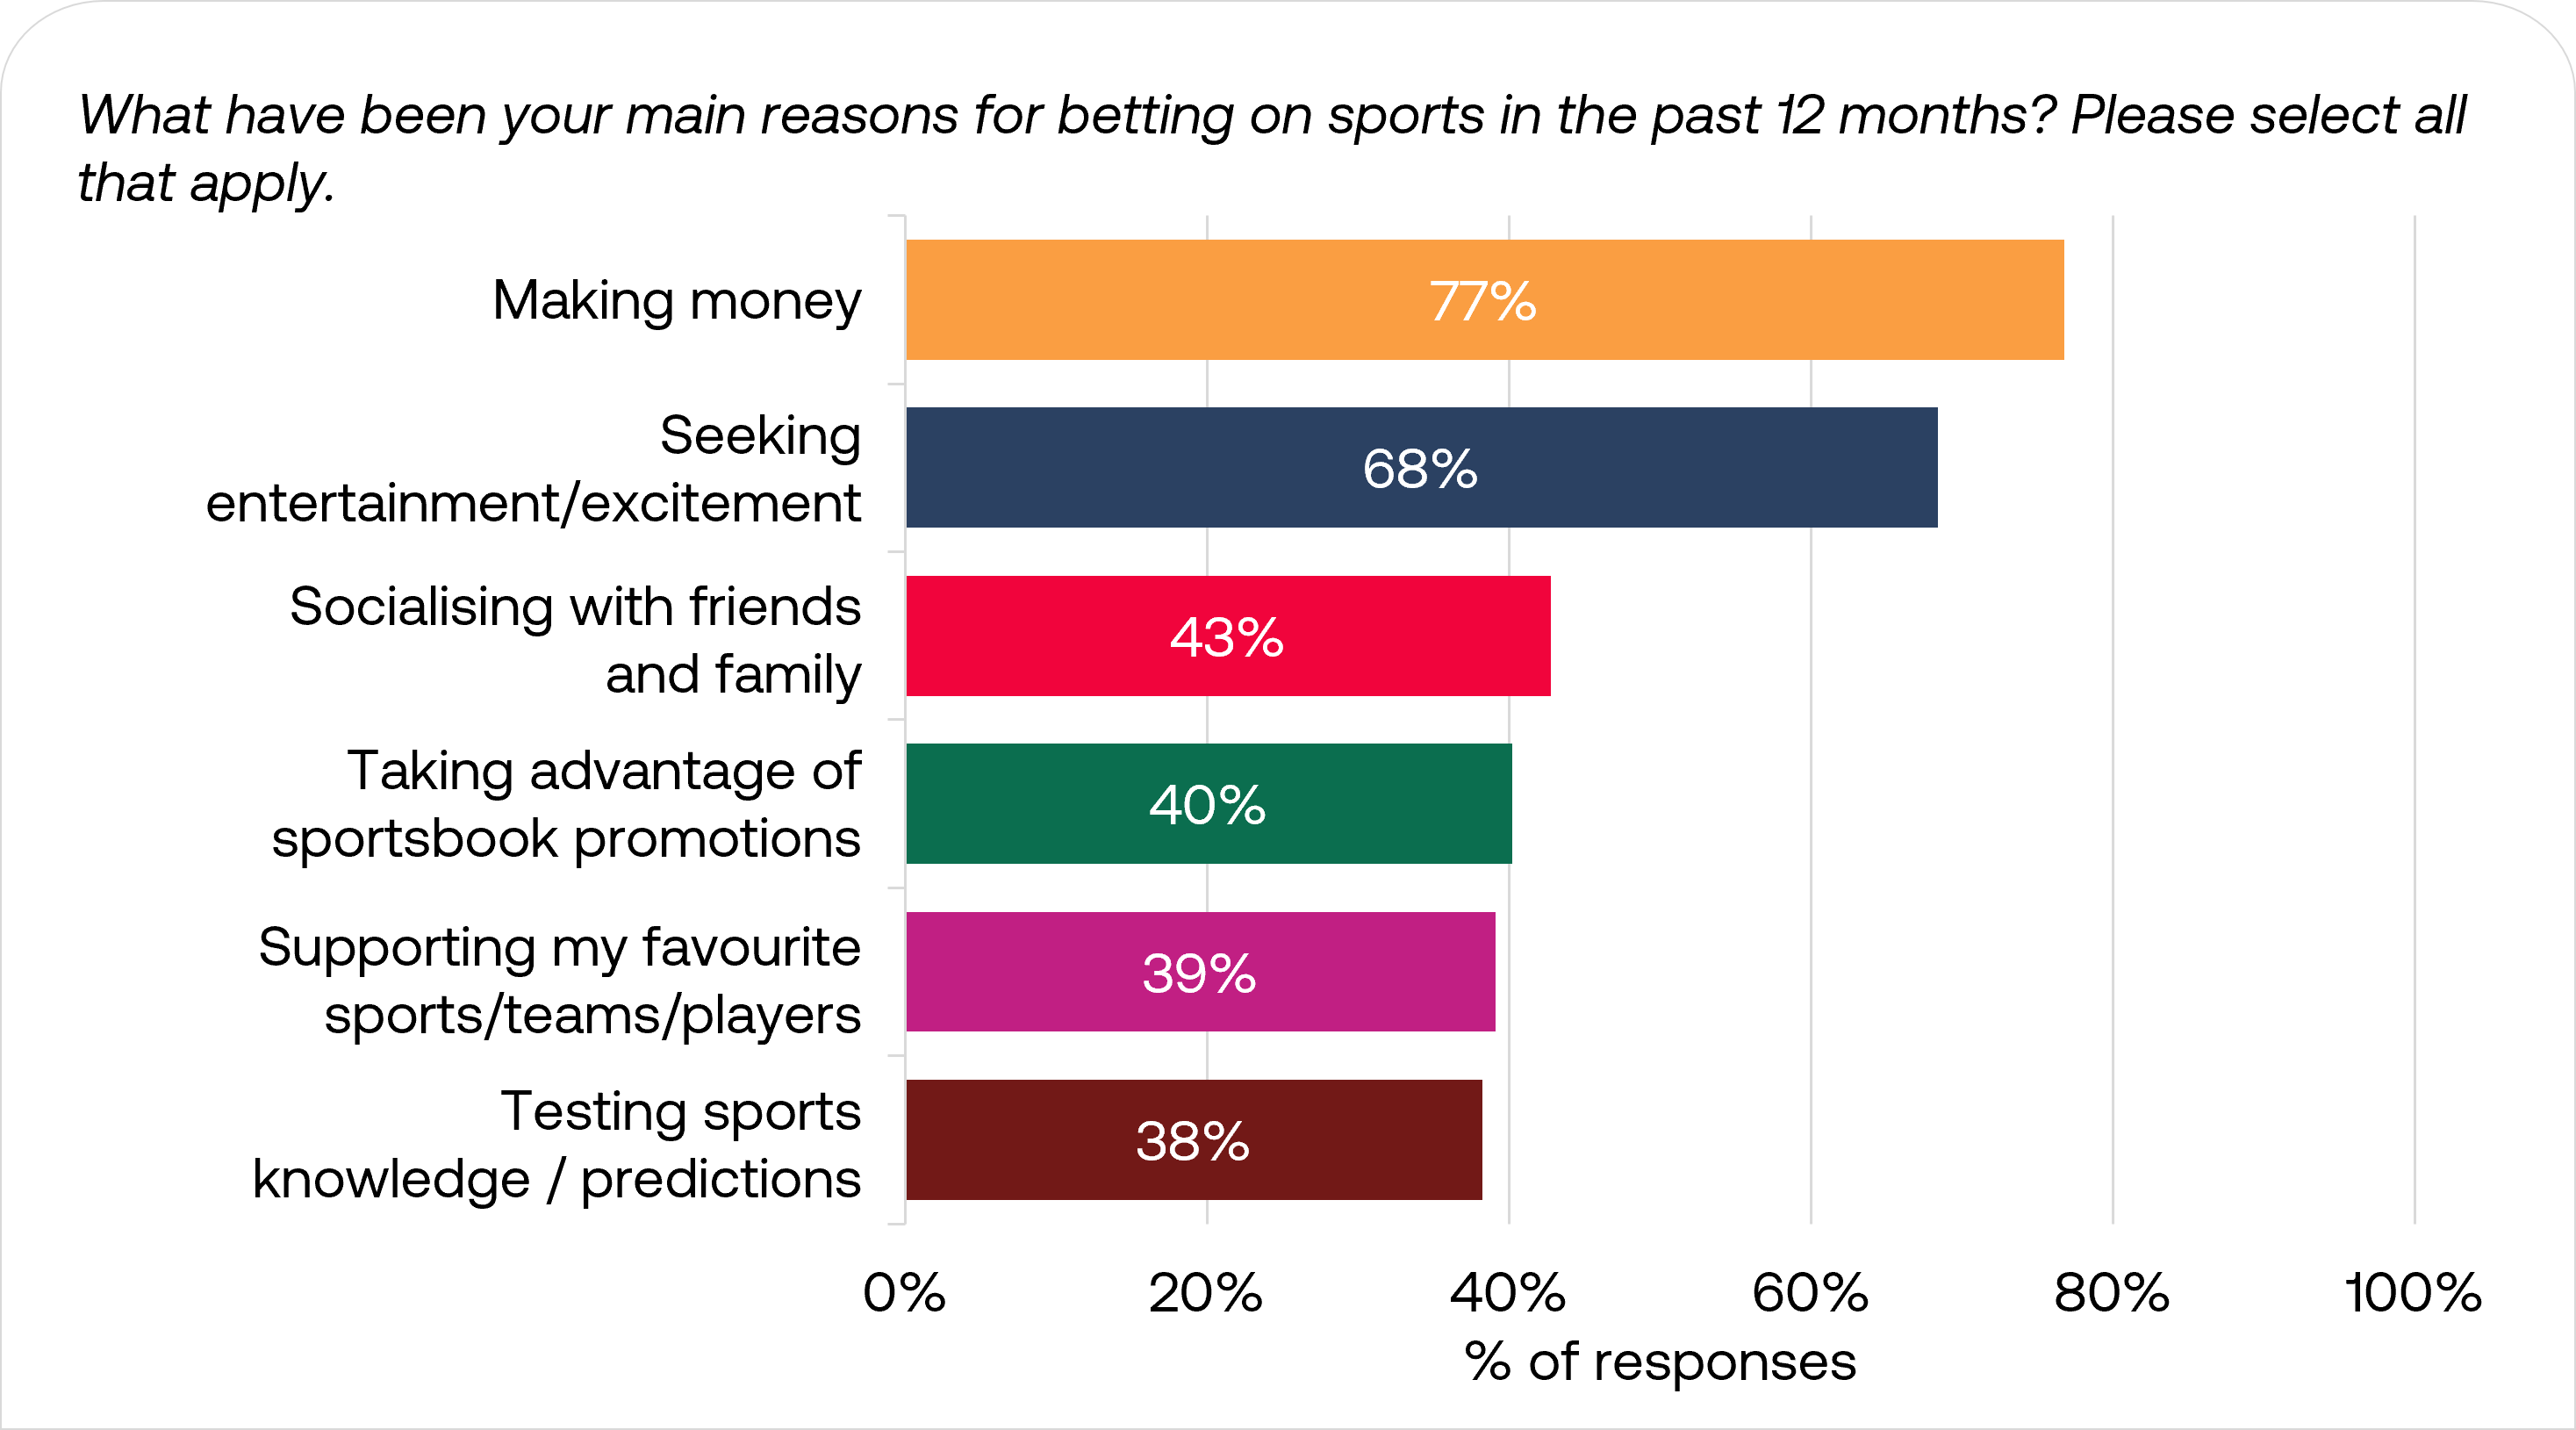
Financial gain is the leading betting motivation, with 77% of active bettors citing making money as their primary reason for betting, followed by excitement and entertainment at 68%. The remaining motivations show a tight grouping, with socialising with friends and family at 43 percent, taking advantage of promotions at 40 percent, supporting favorite teams at 39 percent, and testing sports knowledge at 38 percent.
Among active bettors, self-reported performance shows a surprisingly optimistic picture, with 42% of bettors claiming to be profitable over the last 12 months, as 22% report being significantly ahead and 20% report being slightly ahead. Another 23% report breaking even, 27% acknowledge losses, with 19% reporting slight losses and 8% significant losses.
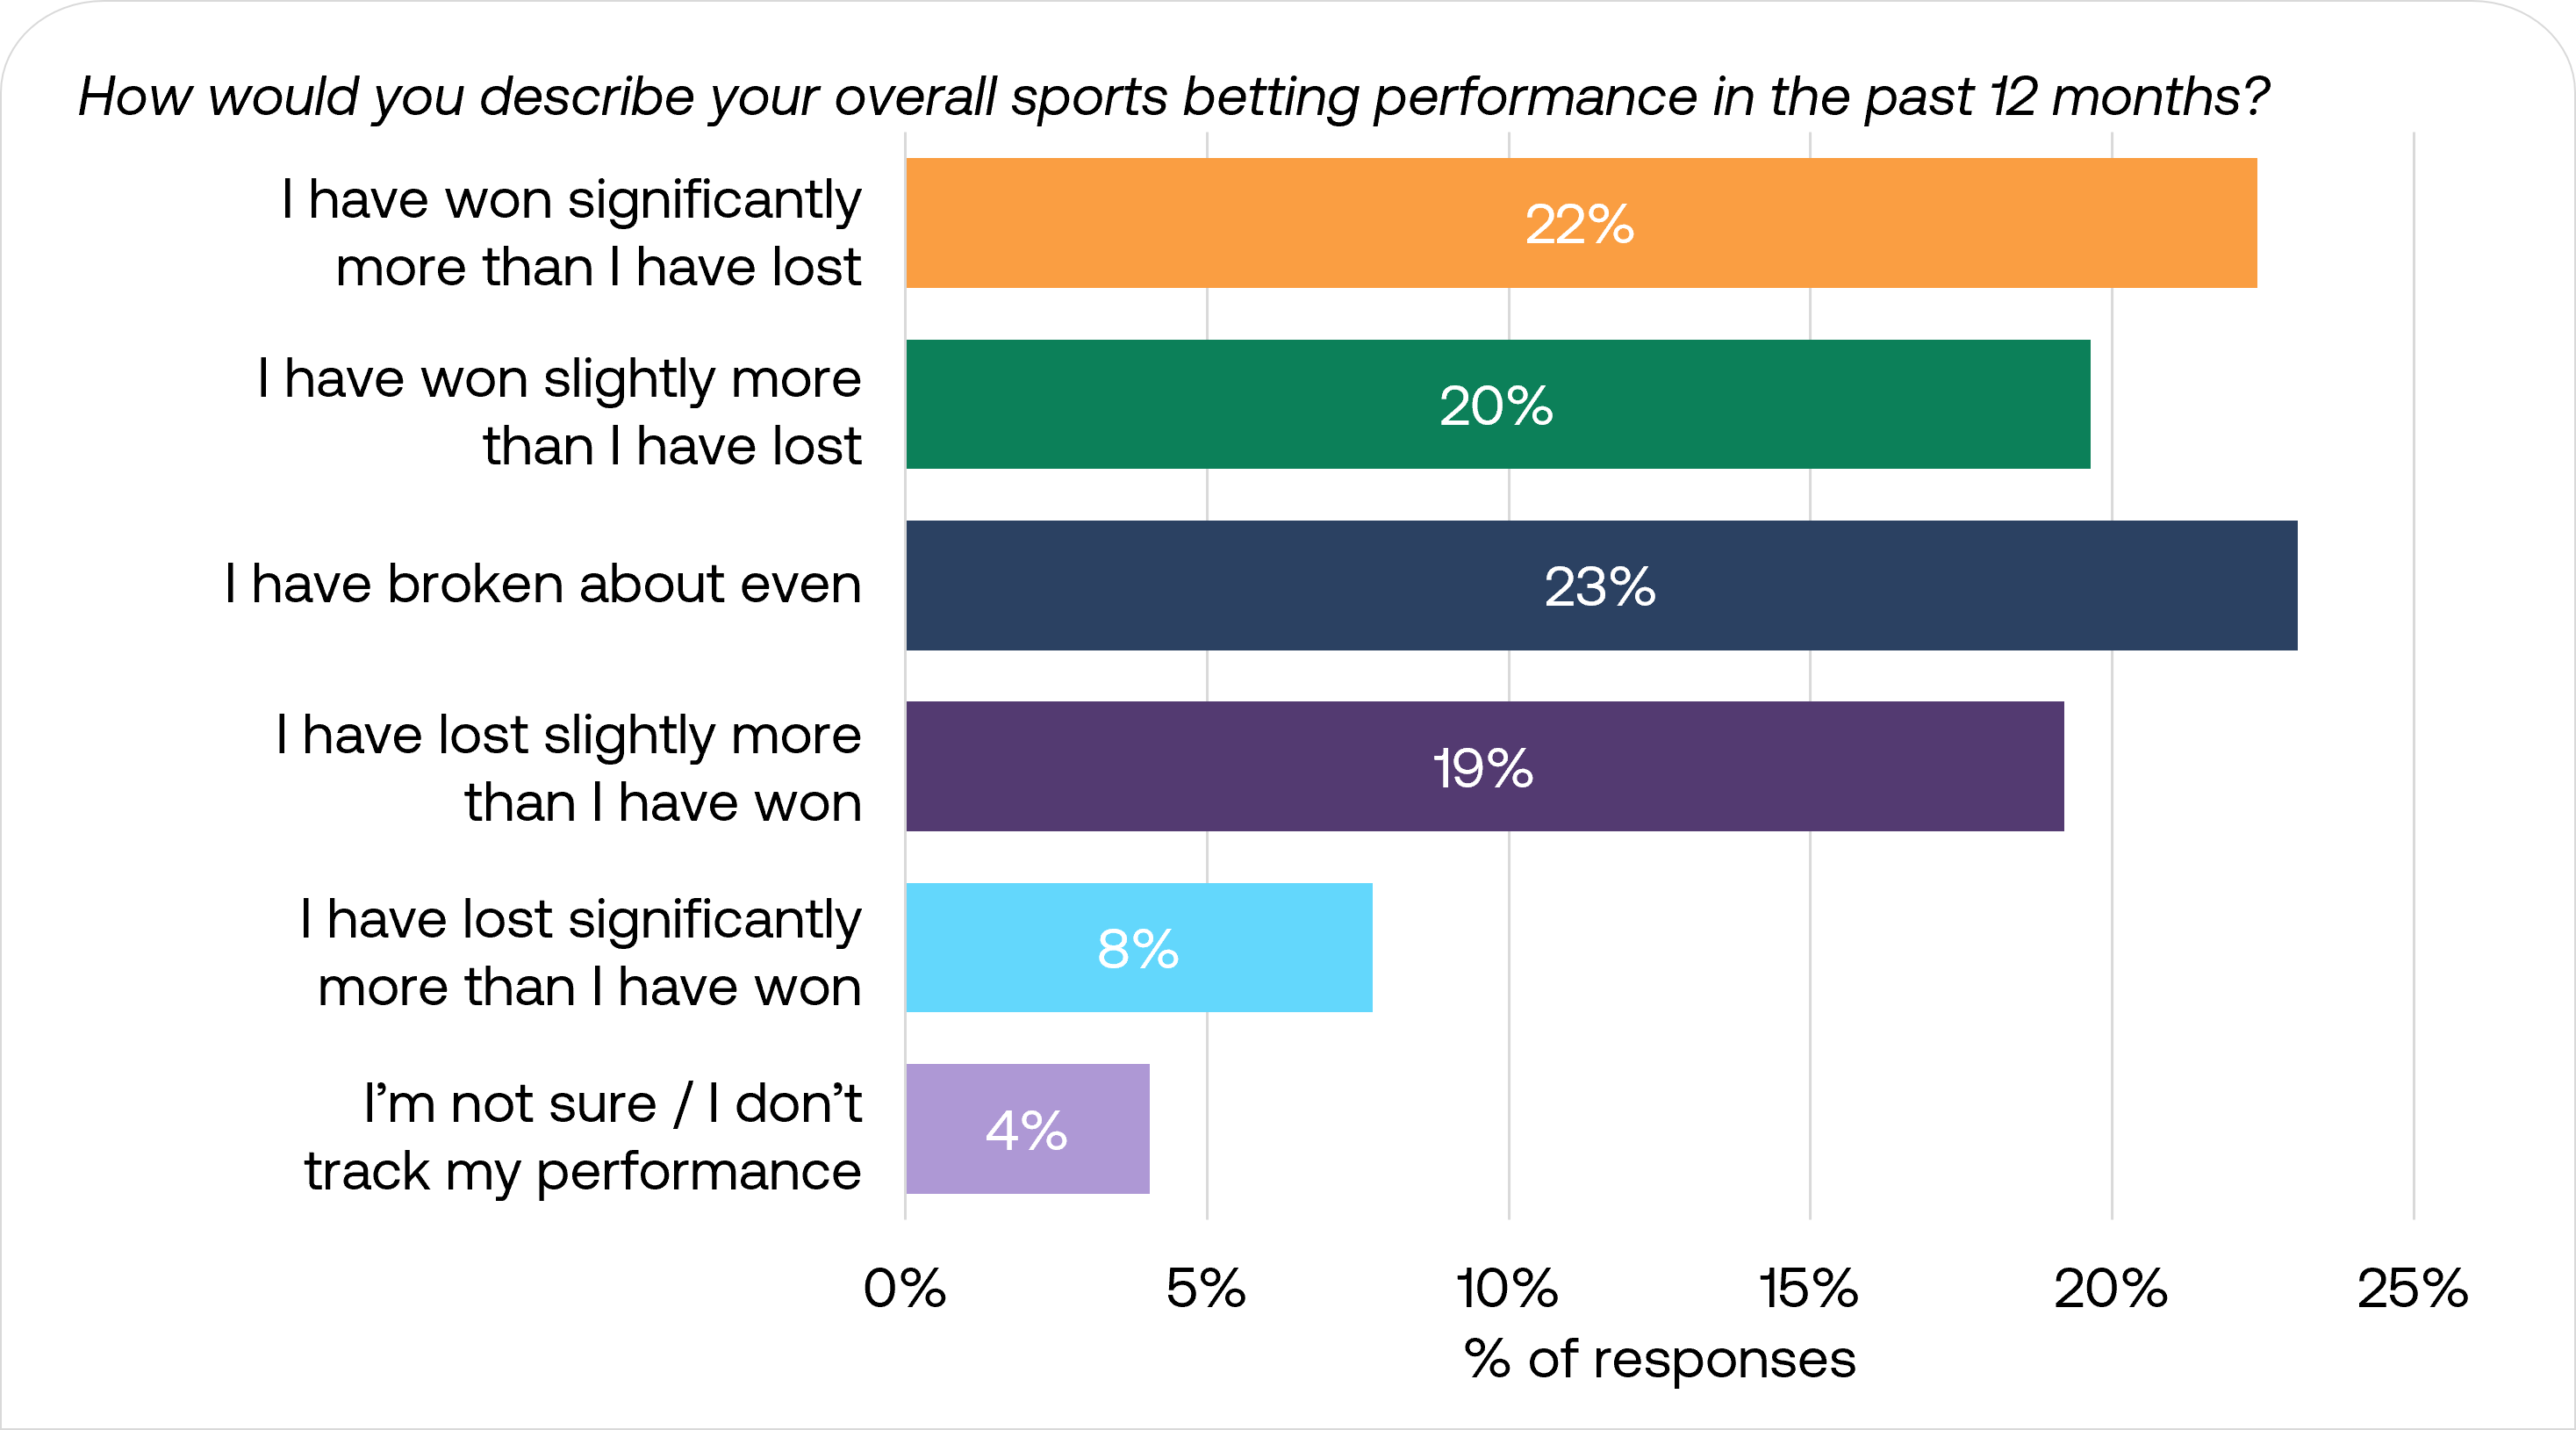
These self-reported results suggest either unusual success among survey respondents or potential bias in how bettors assess their gambling outcomes.
Sports betting platform usage and attitude
Brand awareness, usage, and adoption patterns
To learn more about the awareness and usage of sports betting platforms, we asked respondents four questions regarding 17 of the most popular sports betting platforms:
- Which of the following sports betting brands do you recognise?
- Which of the following sports betting platforms/apps have you trialled?
- Which of the following sports betting platforms/apps have you used beyond just trying them out?
- Which of the following sports betting platforms/apps do you use the most?
These questions track the customer conversion funnel from initial awareness through to platform loyalty. By examining how each platform performs across these metrics, we can identify where brands successfully capture attention, where they convert interest into trials, and critically, where they either succeed or struggle to become a bettor’s preferred platform.
Brand recognition remained strong across the industry leaders, with the top 8 platforms achieving recognition rates above 60%. DraftKings and FanDuel dominated the market, with recognition rates of 93% and 90% respectively, and each achieving high trial rates over 40%. DraftKings led in most-used status at 26%, followed by FanDuel at 19%. BetMGM maintained a strong third position with 6% of users identifying it as their most-used platform, while newer entrants Fanatics Sportsbook and ESPN BET achieved solid brand recognition at 82% and 81% respectively, though with lower most-used rates of 3% each.
Beyond DraftKings and FanDuel, the most recognised sportsbooks appear successful in building awareness and encouraging initial trials, but struggle significantly with becoming bettors’ primary platform. This is particularly evident with BetMGM and Fanatics, who despite achieving over 80% recognition and trial rates above 25%, only capture 3-6% of bettors who identify them as their most frequently used sportsbook.
A distinct middle tier of operators emerged, with WynnBet, Bet Rivers, Prime Sportsbook, Borgata Sportsbook, Superbook, and Sportstrade showing recognition rates between 45% and 27%. The remaining platforms, including Desert Diamond, SBK, and Crab Sports, formed a lower tier with recognition rates clustering between 16% and 14%.
Notably, the significant gap between recognition and regular usage rates suggests that while operators have succeeded in building brand awareness through aggressive marketing, converting this awareness into loyal customers remains a key challenge.
Sports betting platform features ranked by importance
The survey included a MaxDiff analysis to identify the relative importance of different features in sports betting platform selection. Respondents were presented with multiple sets of platform features and asked to select which features had the strongest and weakest influence on their choice of betting platform.
Fast withdrawal processing ranked as the most valued feature, followed by cash out bet options, showing that users prioritise control over their funds. Reward programs and live in-game betting options hold moderate importance. At the other end of the spectrum, users place the least relative importance on social betting features and security measures like facial ID/biometric login. The stark difference between the highest and lowest scores reinforces that users overwhelmingly prioritise efficient transaction features over social engagement and security elements when choosing betting platforms.
Looking at the MaxDiff results for potential sports bettors revealed remarkably similar preferences to current sports bettors, despite having no direct experience with betting platforms. Fast withdrawals and cash out options ranked as the most important features for both groups, while social and security features were consistently least valued. This alignment suggests potential sports bettors have clear expectations about what matters in a platform before they start betting, likely shaped by their experiences with other digital financial services.
The only subtle differences appeared in slightly stronger preferences among potential sports bettors for multiple payment options and rewards programs, though the overall pattern shows that features most valued by current sports bettors are also the most important to those considering entering the market.
Advertising exposure and impact
Advertising exposure
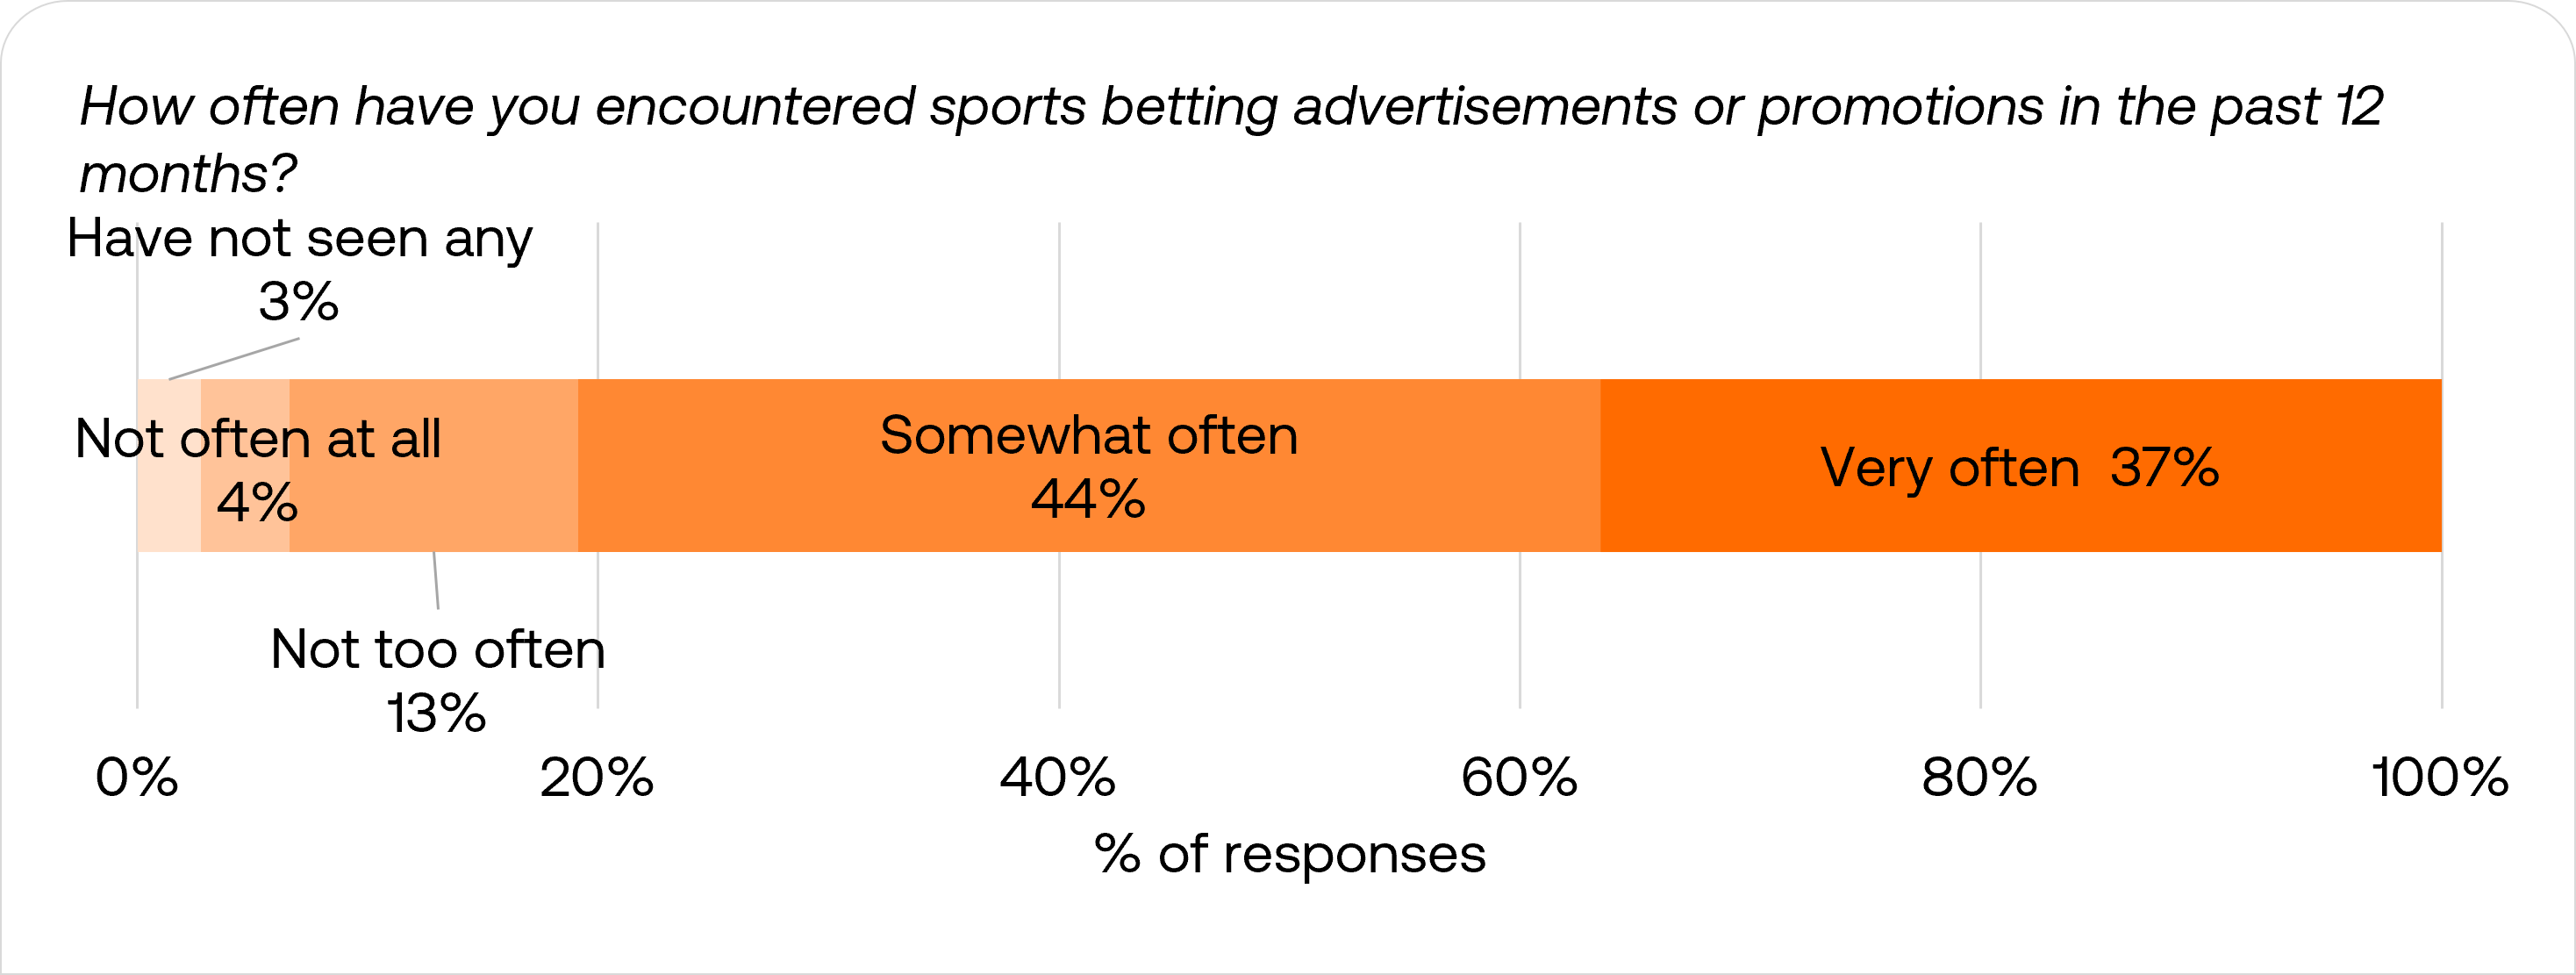
The prevalence of sports betting advertising is evident in the survey results, with 81% of respondents encountering these promotions either somewhat often or very often. Only 3% of respondents reported not seeing any sports betting advertisements in the past 12 months, while 17% saw them infrequently.
Impact of advertising types
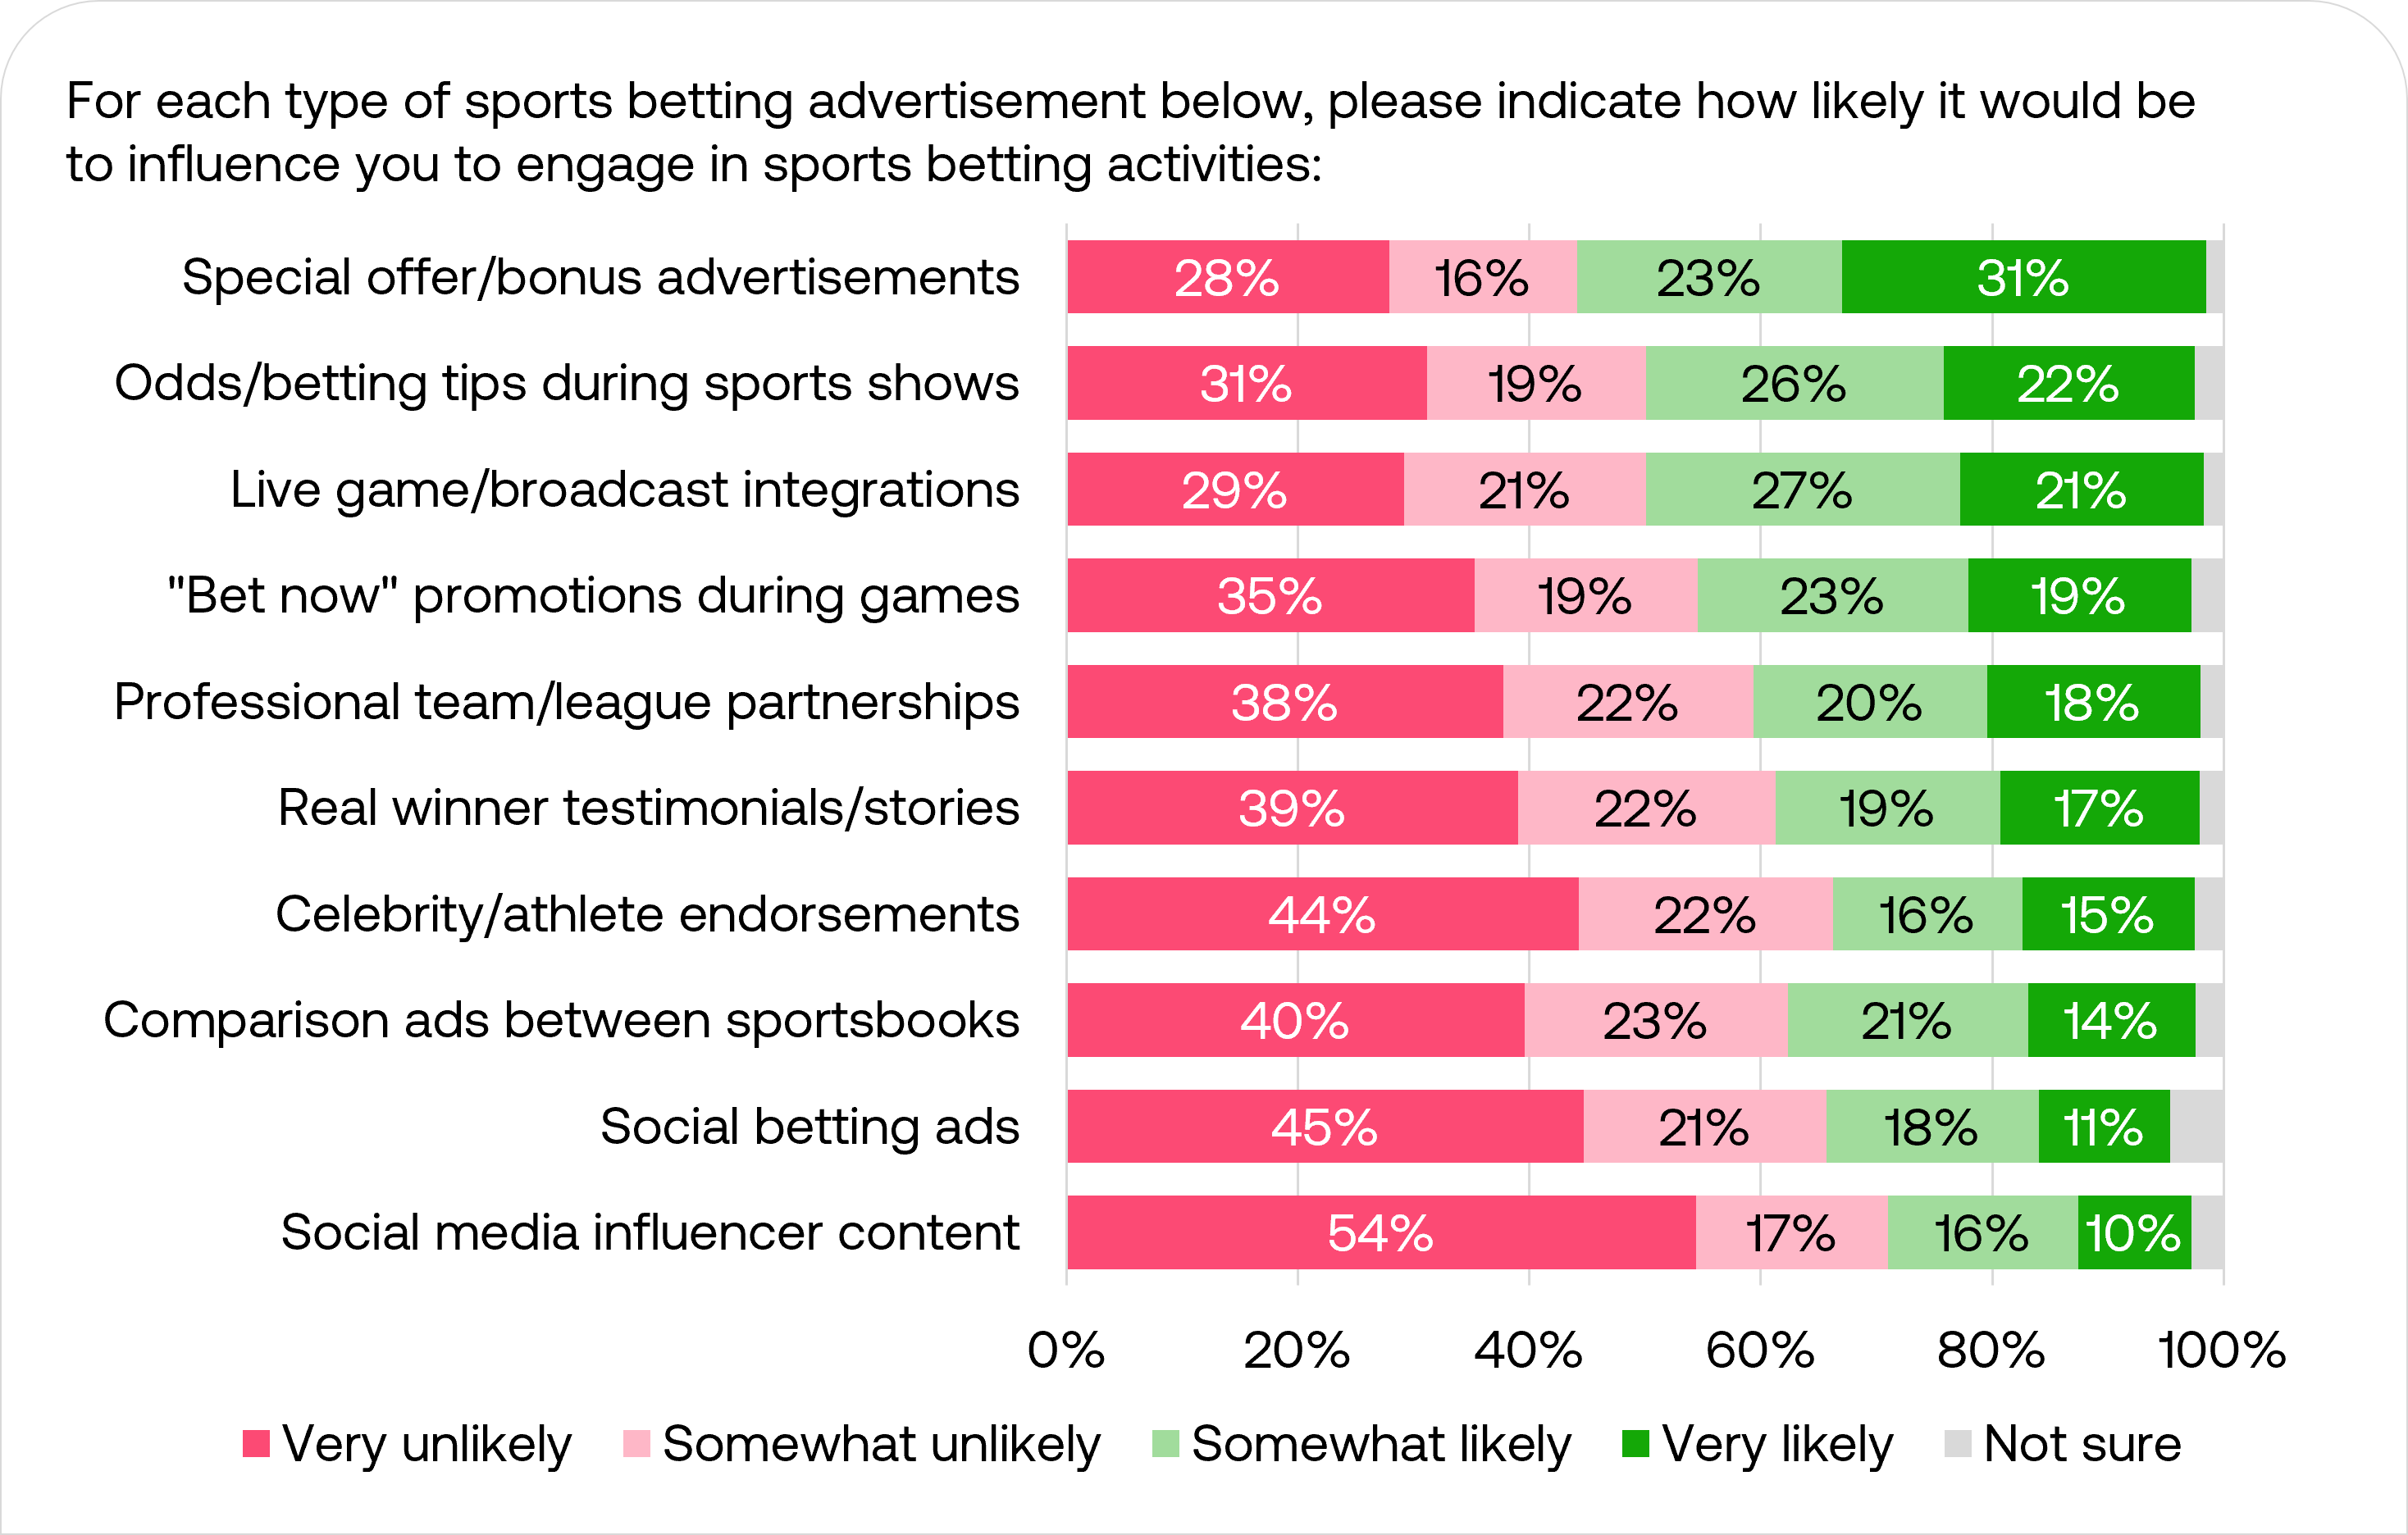
Survey data reveals a clear hierarchy in the effectiveness of different sports betting advertising approaches. Special offers and bonus advertisements emerge as the most influential, with 54% of respondents indicating they would likely be influenced by these promotions. Odds and betting tips during sports shows also show strong impact at 48% likely influence.
At the other end of the spectrum, Marketing through influencers and social features proves least effective. Social media influencer content and social betting ads show the highest negative responses, with 54% and 45% respectively saying they would be very unlikely to be influenced by these approaches.
Traditional marketing through team sponsorships and celebrity endorsements fall in the middle range of effectiveness, suggesting that practical, value-driven advertising resonates more strongly with potential bettors than social proof or influencer-led campaigns.
Impact of promotion types
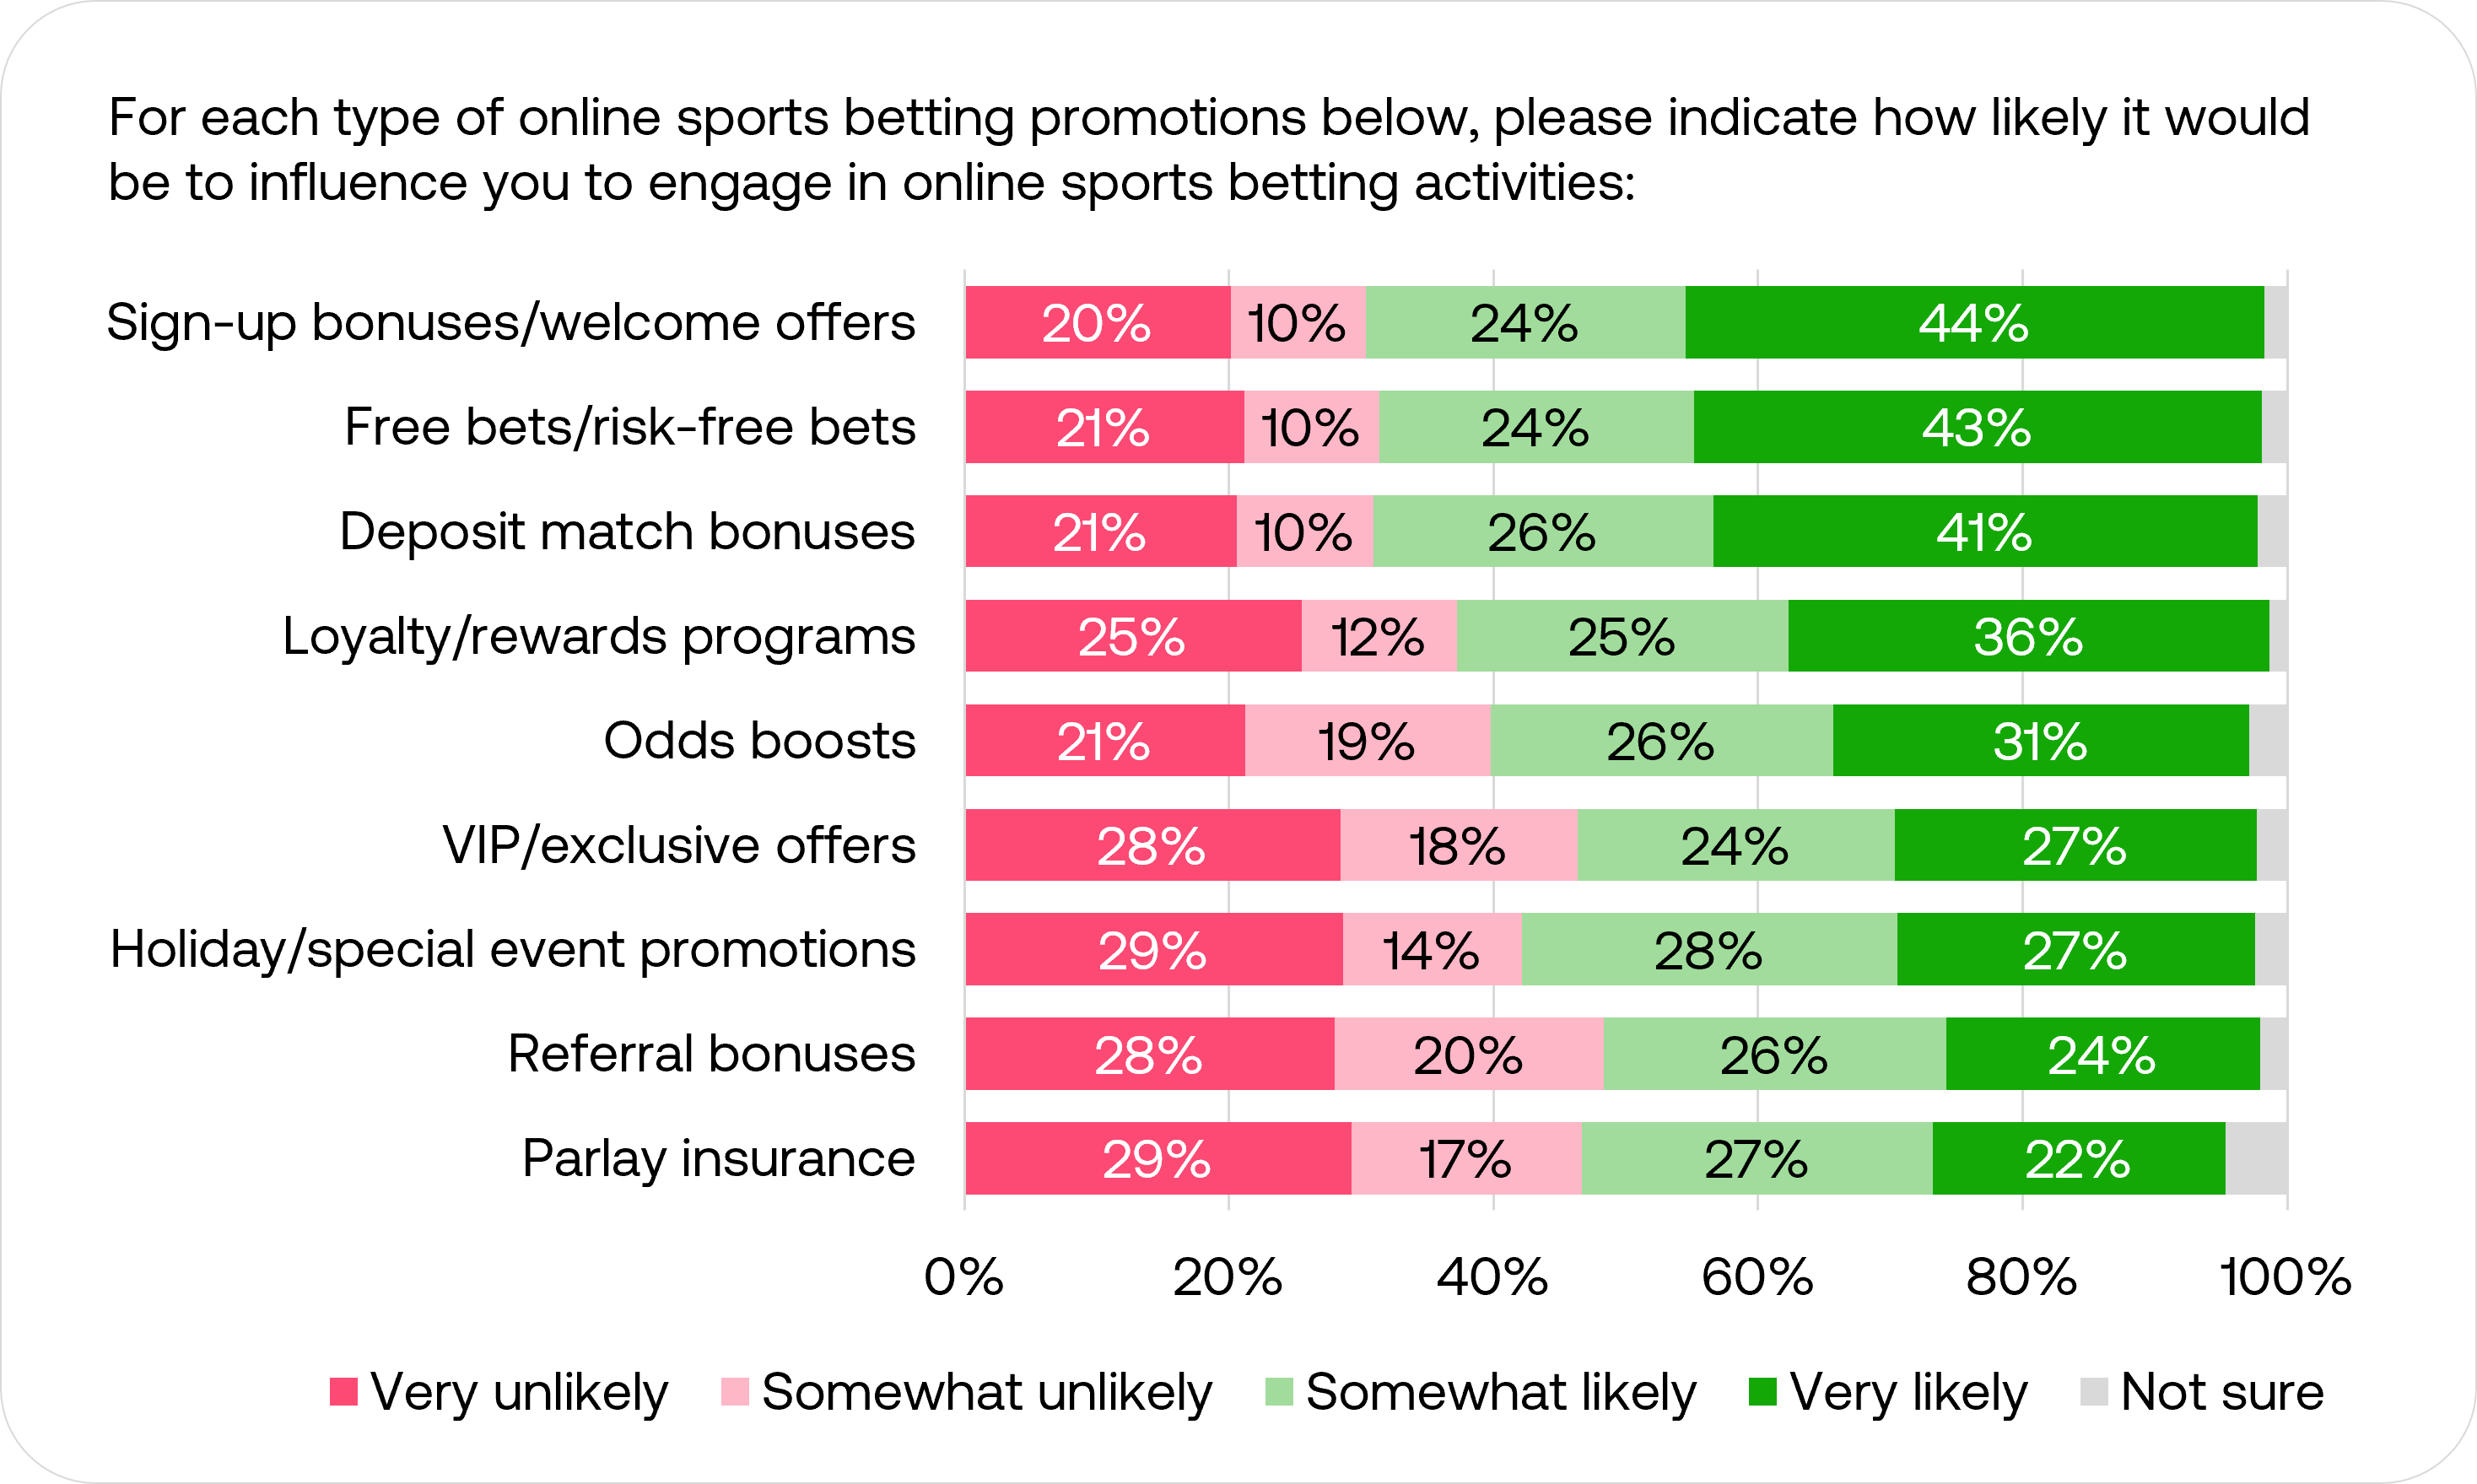
Given that bonus and special offer advertising proved most effective advertising type above, understanding the relative impact of specific promotional mechanics provides valuable insight into bettor behavior.
Survey results show clear preferences in how different promotional offers influence betting behaviour. Sign-up bonuses and welcome offers emerge as the most compelling, with 68% of respondents indicating they would likely be influenced by these promotions. Close behind are free bets and deposit match bonuses at 67% each, showing that initial engagement offers have the strongest pull.
Loyalty and rewards programs maintain solid appeal at 61% positive response, while odds boosts influence 57% of respondents. At the lower end of effectiveness, parlay insurance and referral bonuses show the least impact, though still maintaining positive influence with around 50% of respondents.
The data suggests that front-loaded acquisition offers are significantly more effective at driving engagement than ongoing promotional tools, with users most responsive to promotions that offer clear, immediate value.
Get in touch for the full report
Found these insights valuable? The complete report offers deeper analysis including responses to 40+ questions, detailed segmentation, and more. Contact us to access the full report on the Conjointly platform.


