Conjointly added two new quality checks i.e. extra hard exclusion rules and detection of anomalous network activities to protect your research from fraudulent respondents.
Conjointly already has numerous automated quality checks to make sure your survey data is as clean as possible, especially when it comes from online panels.
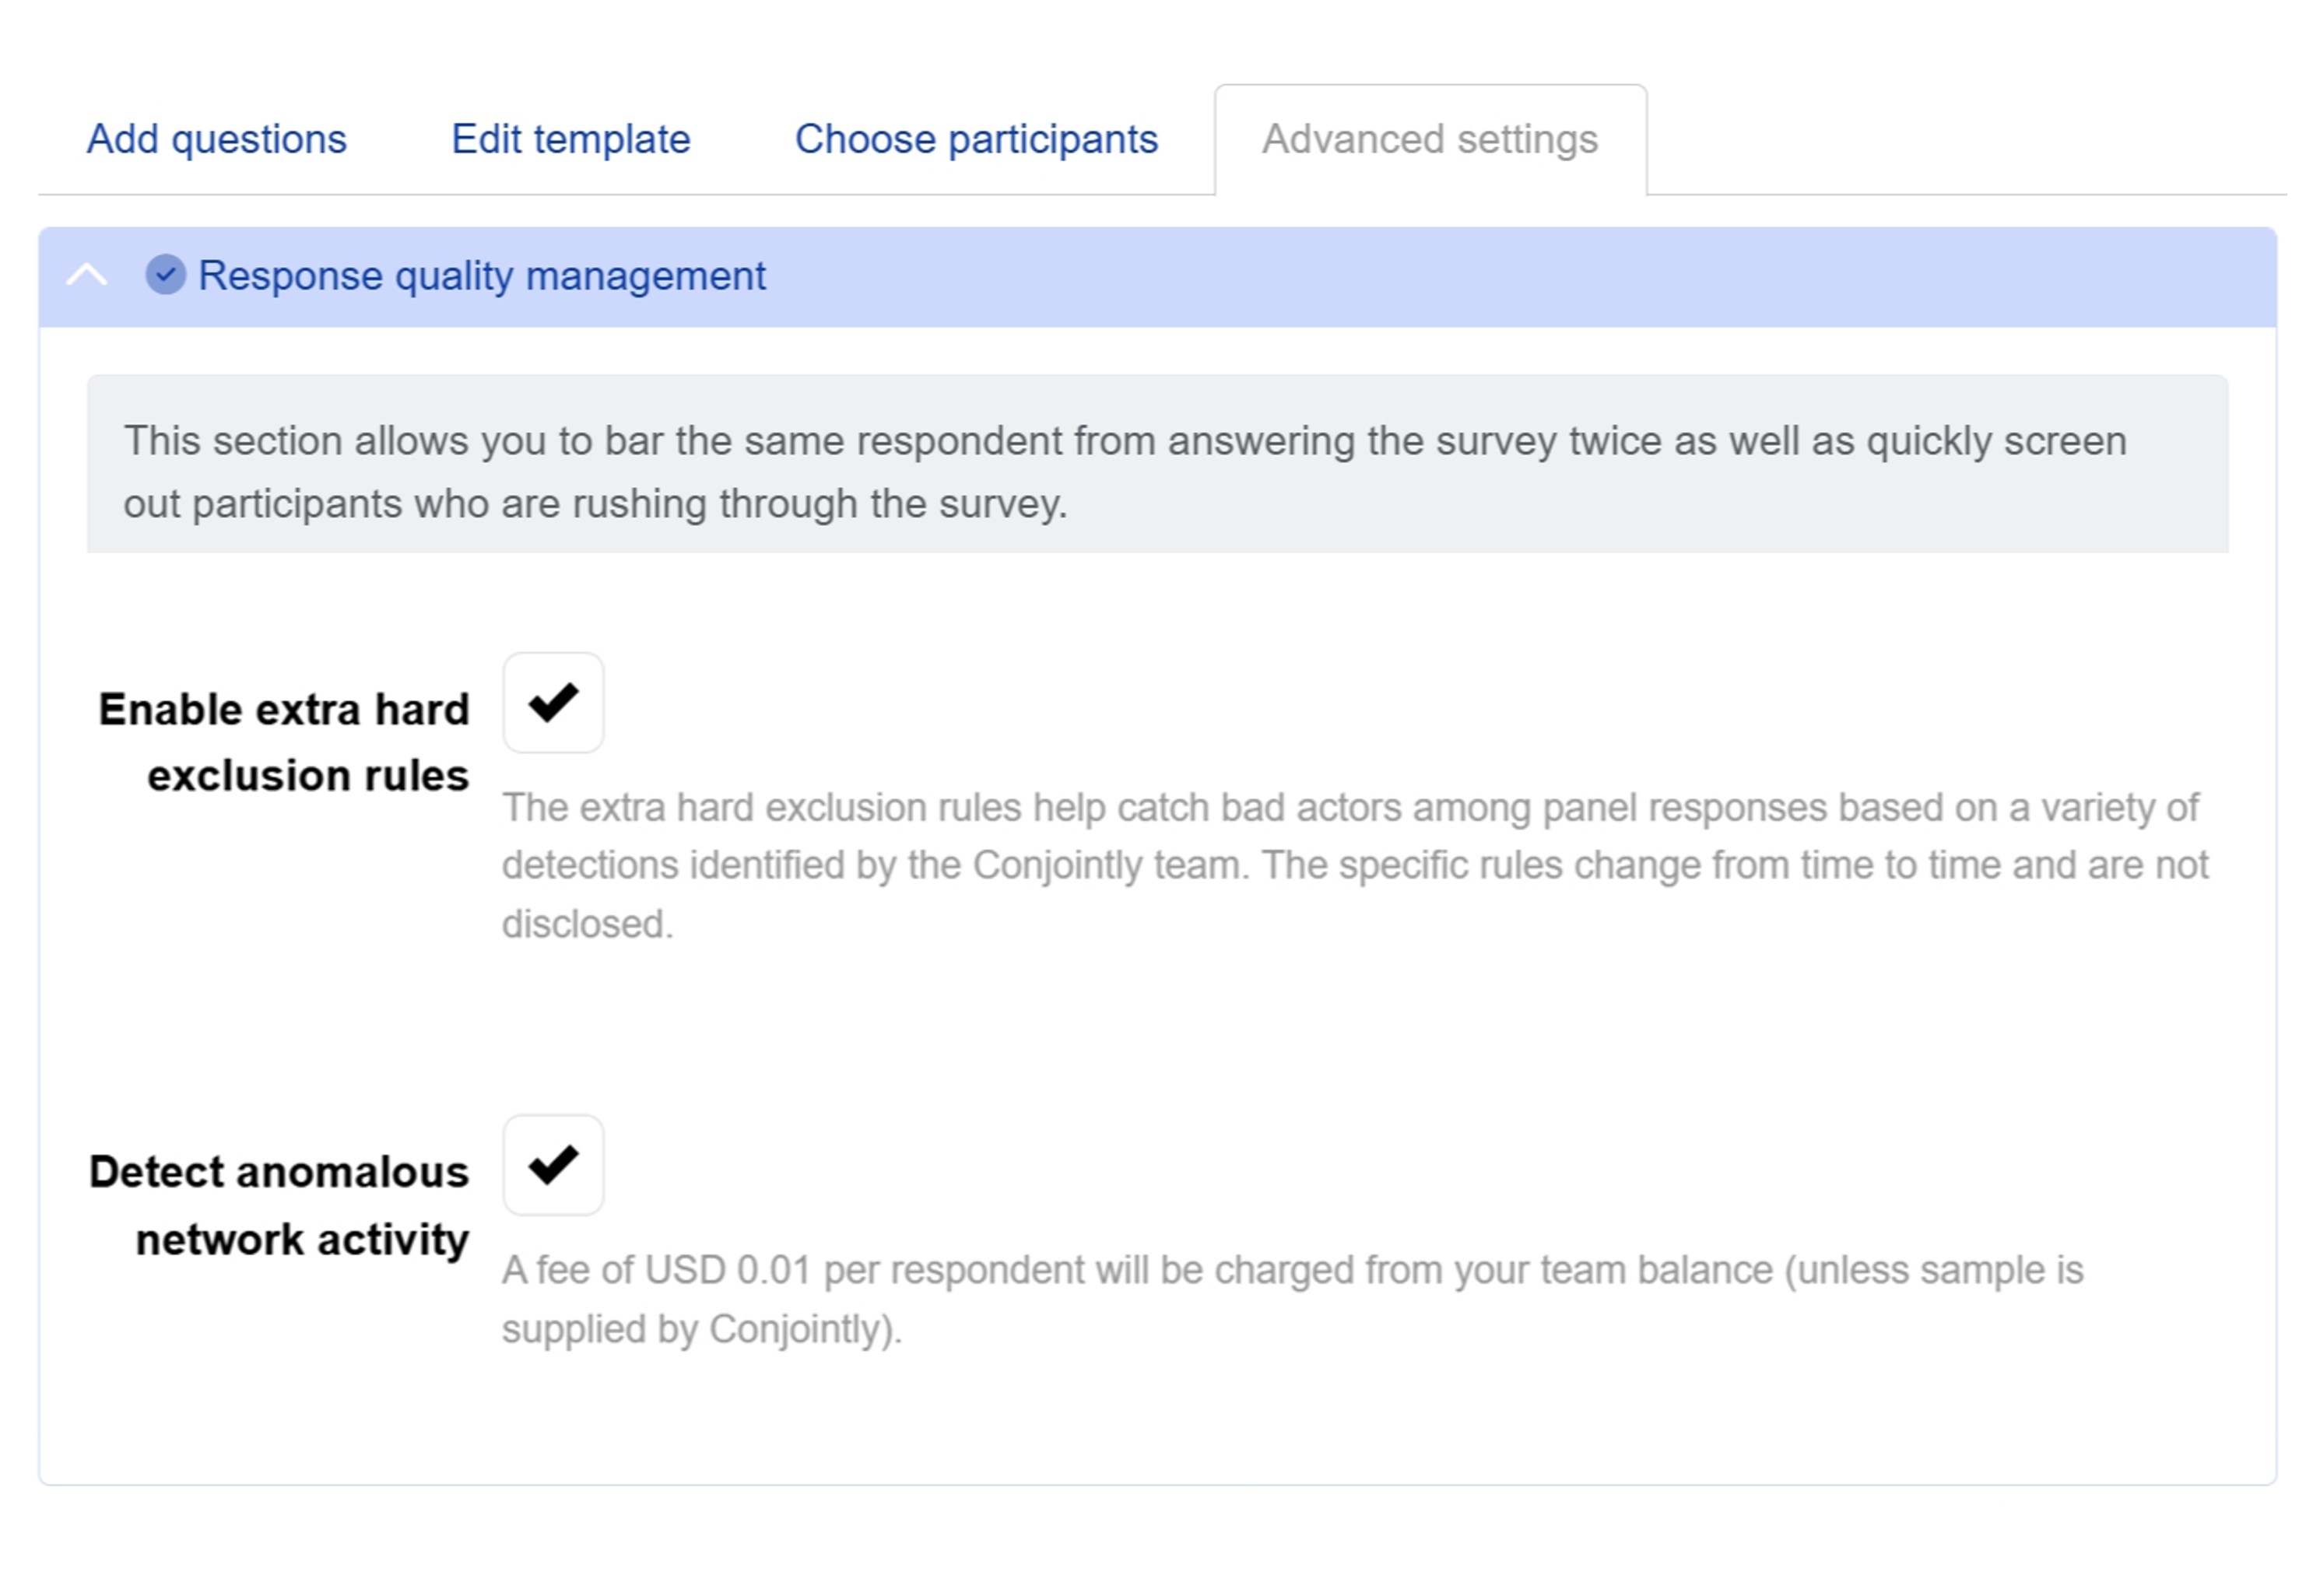
Now, two more quality checks have been added: "extra hard exclusion rules" and "detection of anomalous network activities".
Extra hard exclusion rules
Extra hard exclusion rules are a new set of proprietary rules that identify behaviours strongly linked to fraudulent responses from online panels. These criteria are deliberately undisclosed and continuously updated to protect your data from evolving fraud tactics.
These new rules have been used for several months now when you source respondents through Conjointly. They are now available for you to switch on studies where you bring your own sample, at no cost.

Detection of suspicious network activities
Conjointly has also introduced new protective measures against respondents who conceal their connection details via VPNs, browser spoofing, and other tricks.
In your participant list, you may now notice "Anomalous network activity detected" and "Avoidance of network detection" as reasons for automatic exclusion.

This detection of anomalous network activities intelligently flags suspicious network patterns without disrupting the survey experience. Problematic responses are automatically excluded from your analysis.
Again, these new rules have been used for several months now when you source respondents through Conjointly. They are now available for you to switch on studies where you bring your own sample, at USD 0.01 per survey entry attempt (not per complete).