Conjointly surveyed US respondents to compare their experiences across various research panels, revealing their perspectives on panel experience and earnings potential.
Online research panel platforms provide opportunities and spaces where participants share their opinions and insights. To uncover how respondents feel about their participation across different panel platforms, Conjointly collected feedback from 639 US respondents across ten research panels in April 2025. This overview presents their demographics, satisfaction with different aspects of their panel experience, survey completion rates, and estimated earnings.
Respondent demographics
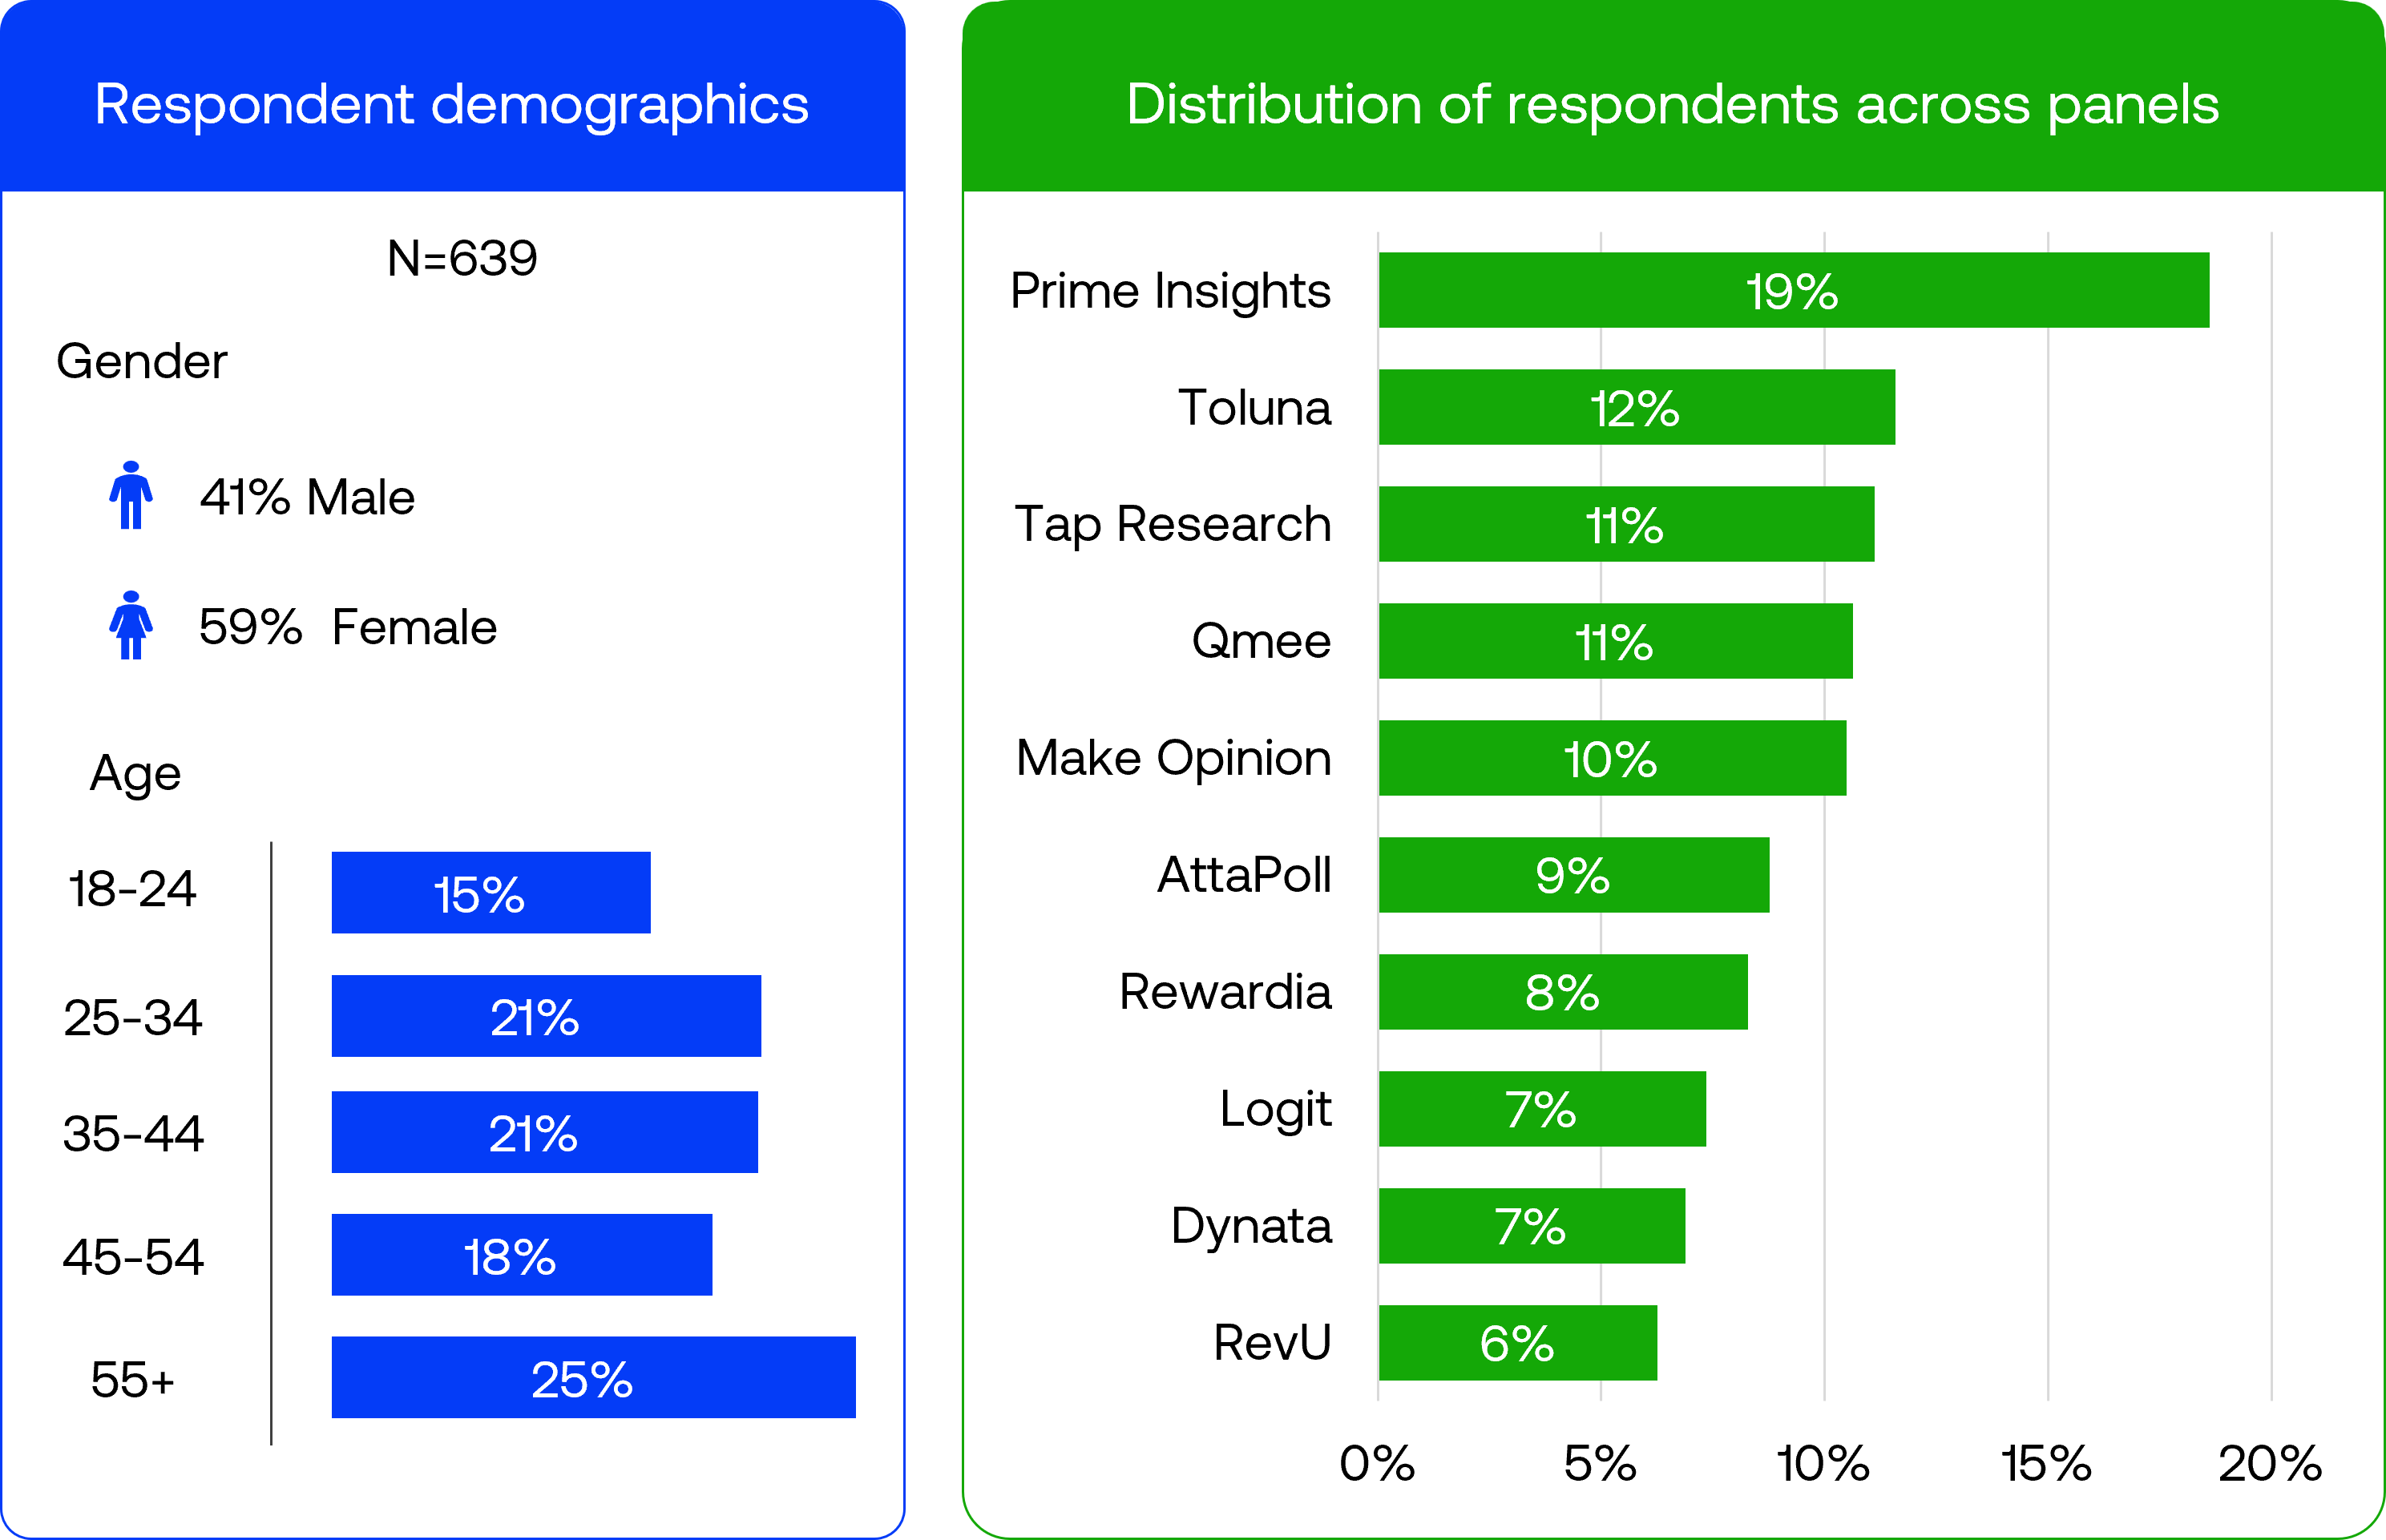
This survey did not implement any targeted quotas for participation. The demographics presented reflect the natural composition of respondents who completed the survey.
The sample, after cleaning low-effort responses, consists of 639 US respondents with 59% female and 41% male participants. The age distribution is relatively balanced across all adult age groups, with those aged 55 and older forming the largest segment at 25%, followed by those 35-44 year-olds and 25-34 year-olds at 21%, respectively.
We aimed to have at least 40 complete responses per panel. We collected more responses from Prime Insights (19%) because the organisation runs several panels (Prime Opinion, 5 Surveys, Hey Cash, TopSurveys) and forwards responses from other platforms. In this survey, we had both panels that rely on dedicated panel sites and apps (e.g., AttaPoll and Prime Opinion) and those that serve surveys through third-party game and other apps (e.g., Make Opinion and RevU).
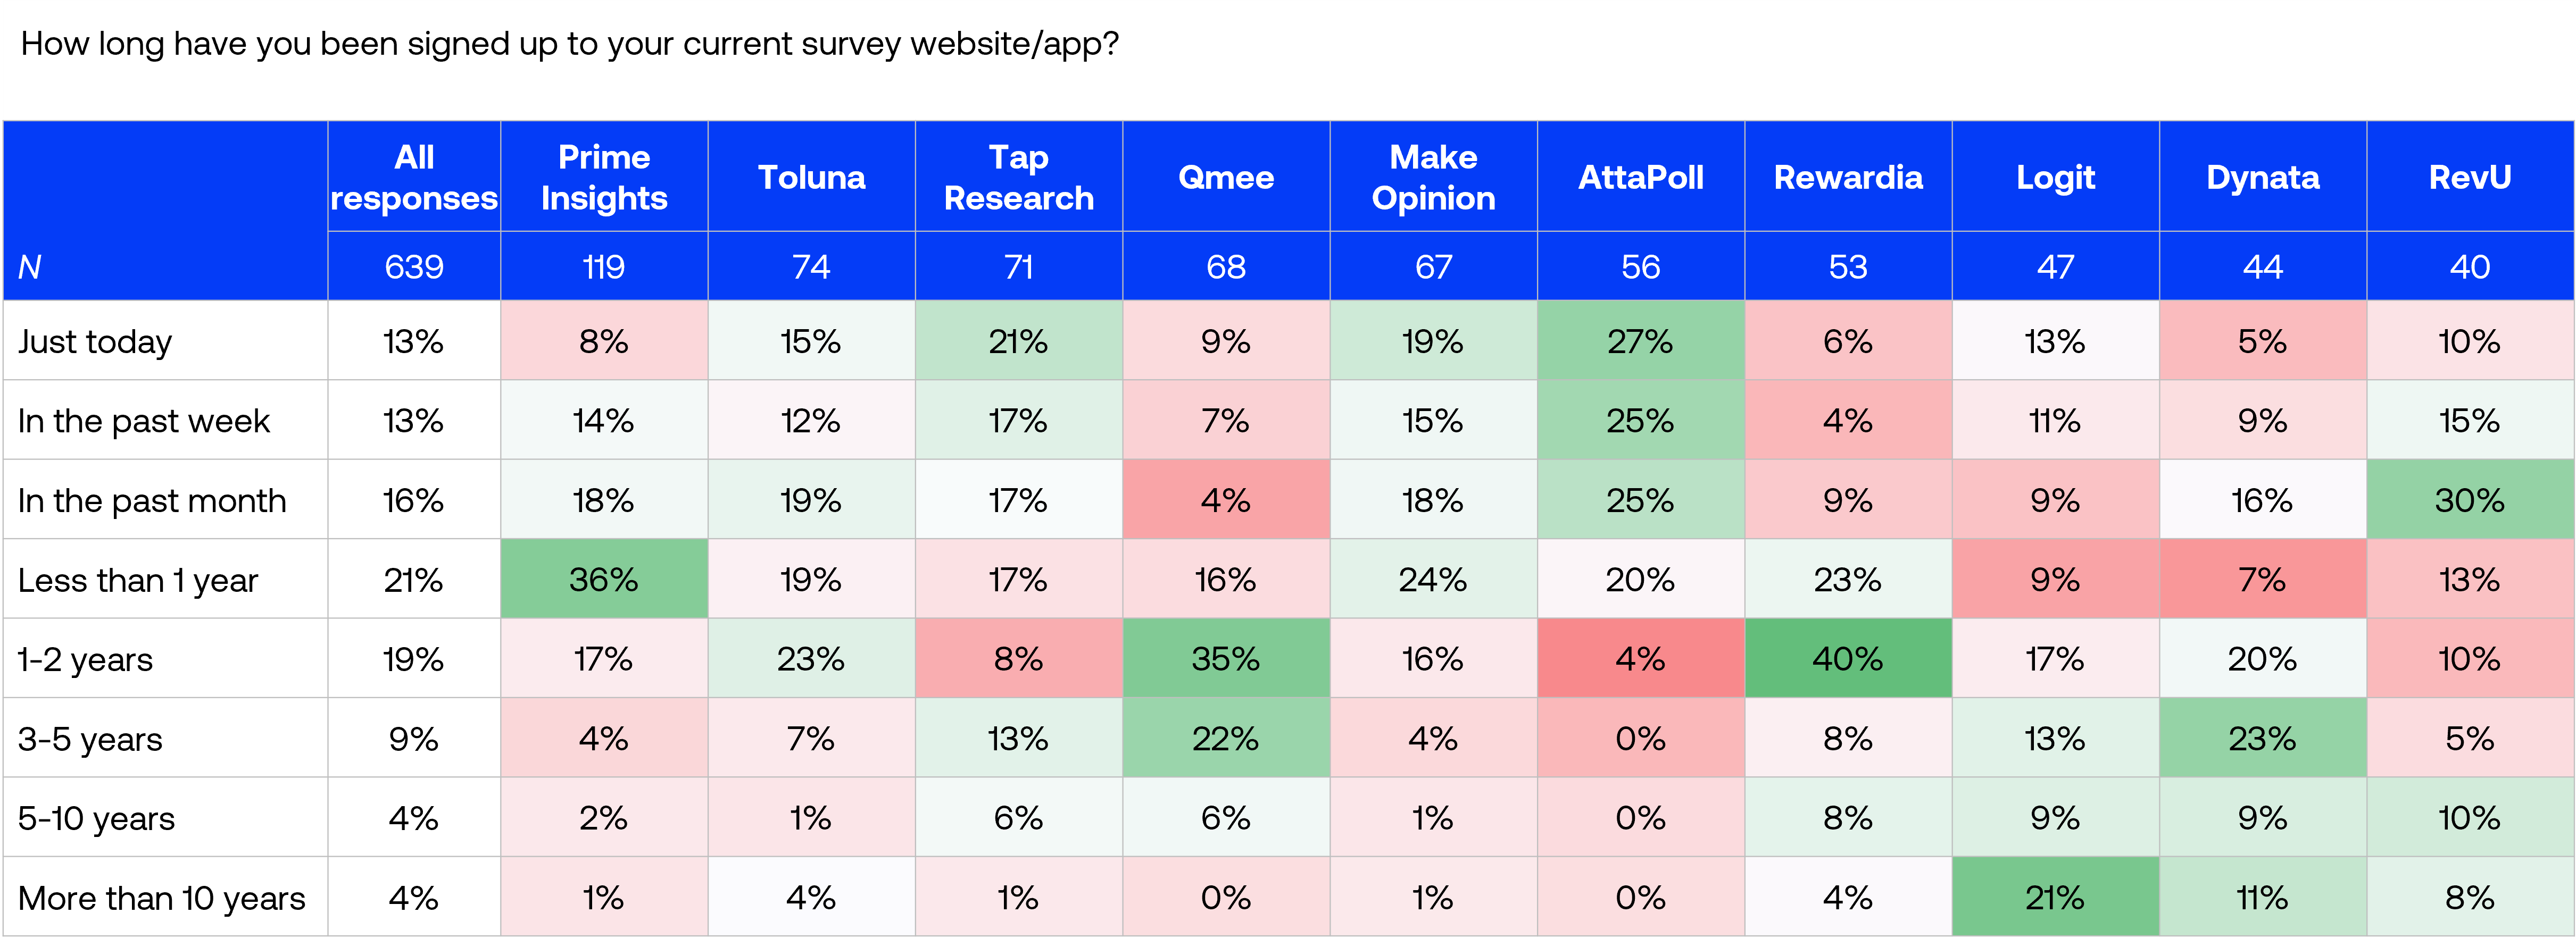
Overall, 63% of participants had been members of their current panel for less than one year, with 42% joining within just the past month. AttaPoll had the highest proportion of new members, with 77% joining within the past month.
Respondents from Logit and Dynata reported more established participation, with 43% of members from each panel having participated for 3+ years. Rewardia showed a notable concentration in the 1-2 year membership range, with 40% of their respondents falling in this category.
Panel experience
We asked four 5-point Likert-scale questions to assess participants’ experiences with their respective panels:
- How satisfied are you with the ease of navigating the survey website/app?
- How satisfied are you with the ease of completing surveys?
- How satisfied are you with the frequency of survey invitations?
- How satisfied are you with the rewards offered after completing the surveys?
- How likely are you to recommend this survey website/app to others?
Participants reported generally positive experiences across research panels, with Qmee and AttaPoll receiving the highest satisfaction ratings.

Panel earnings
Average monthly survey completion
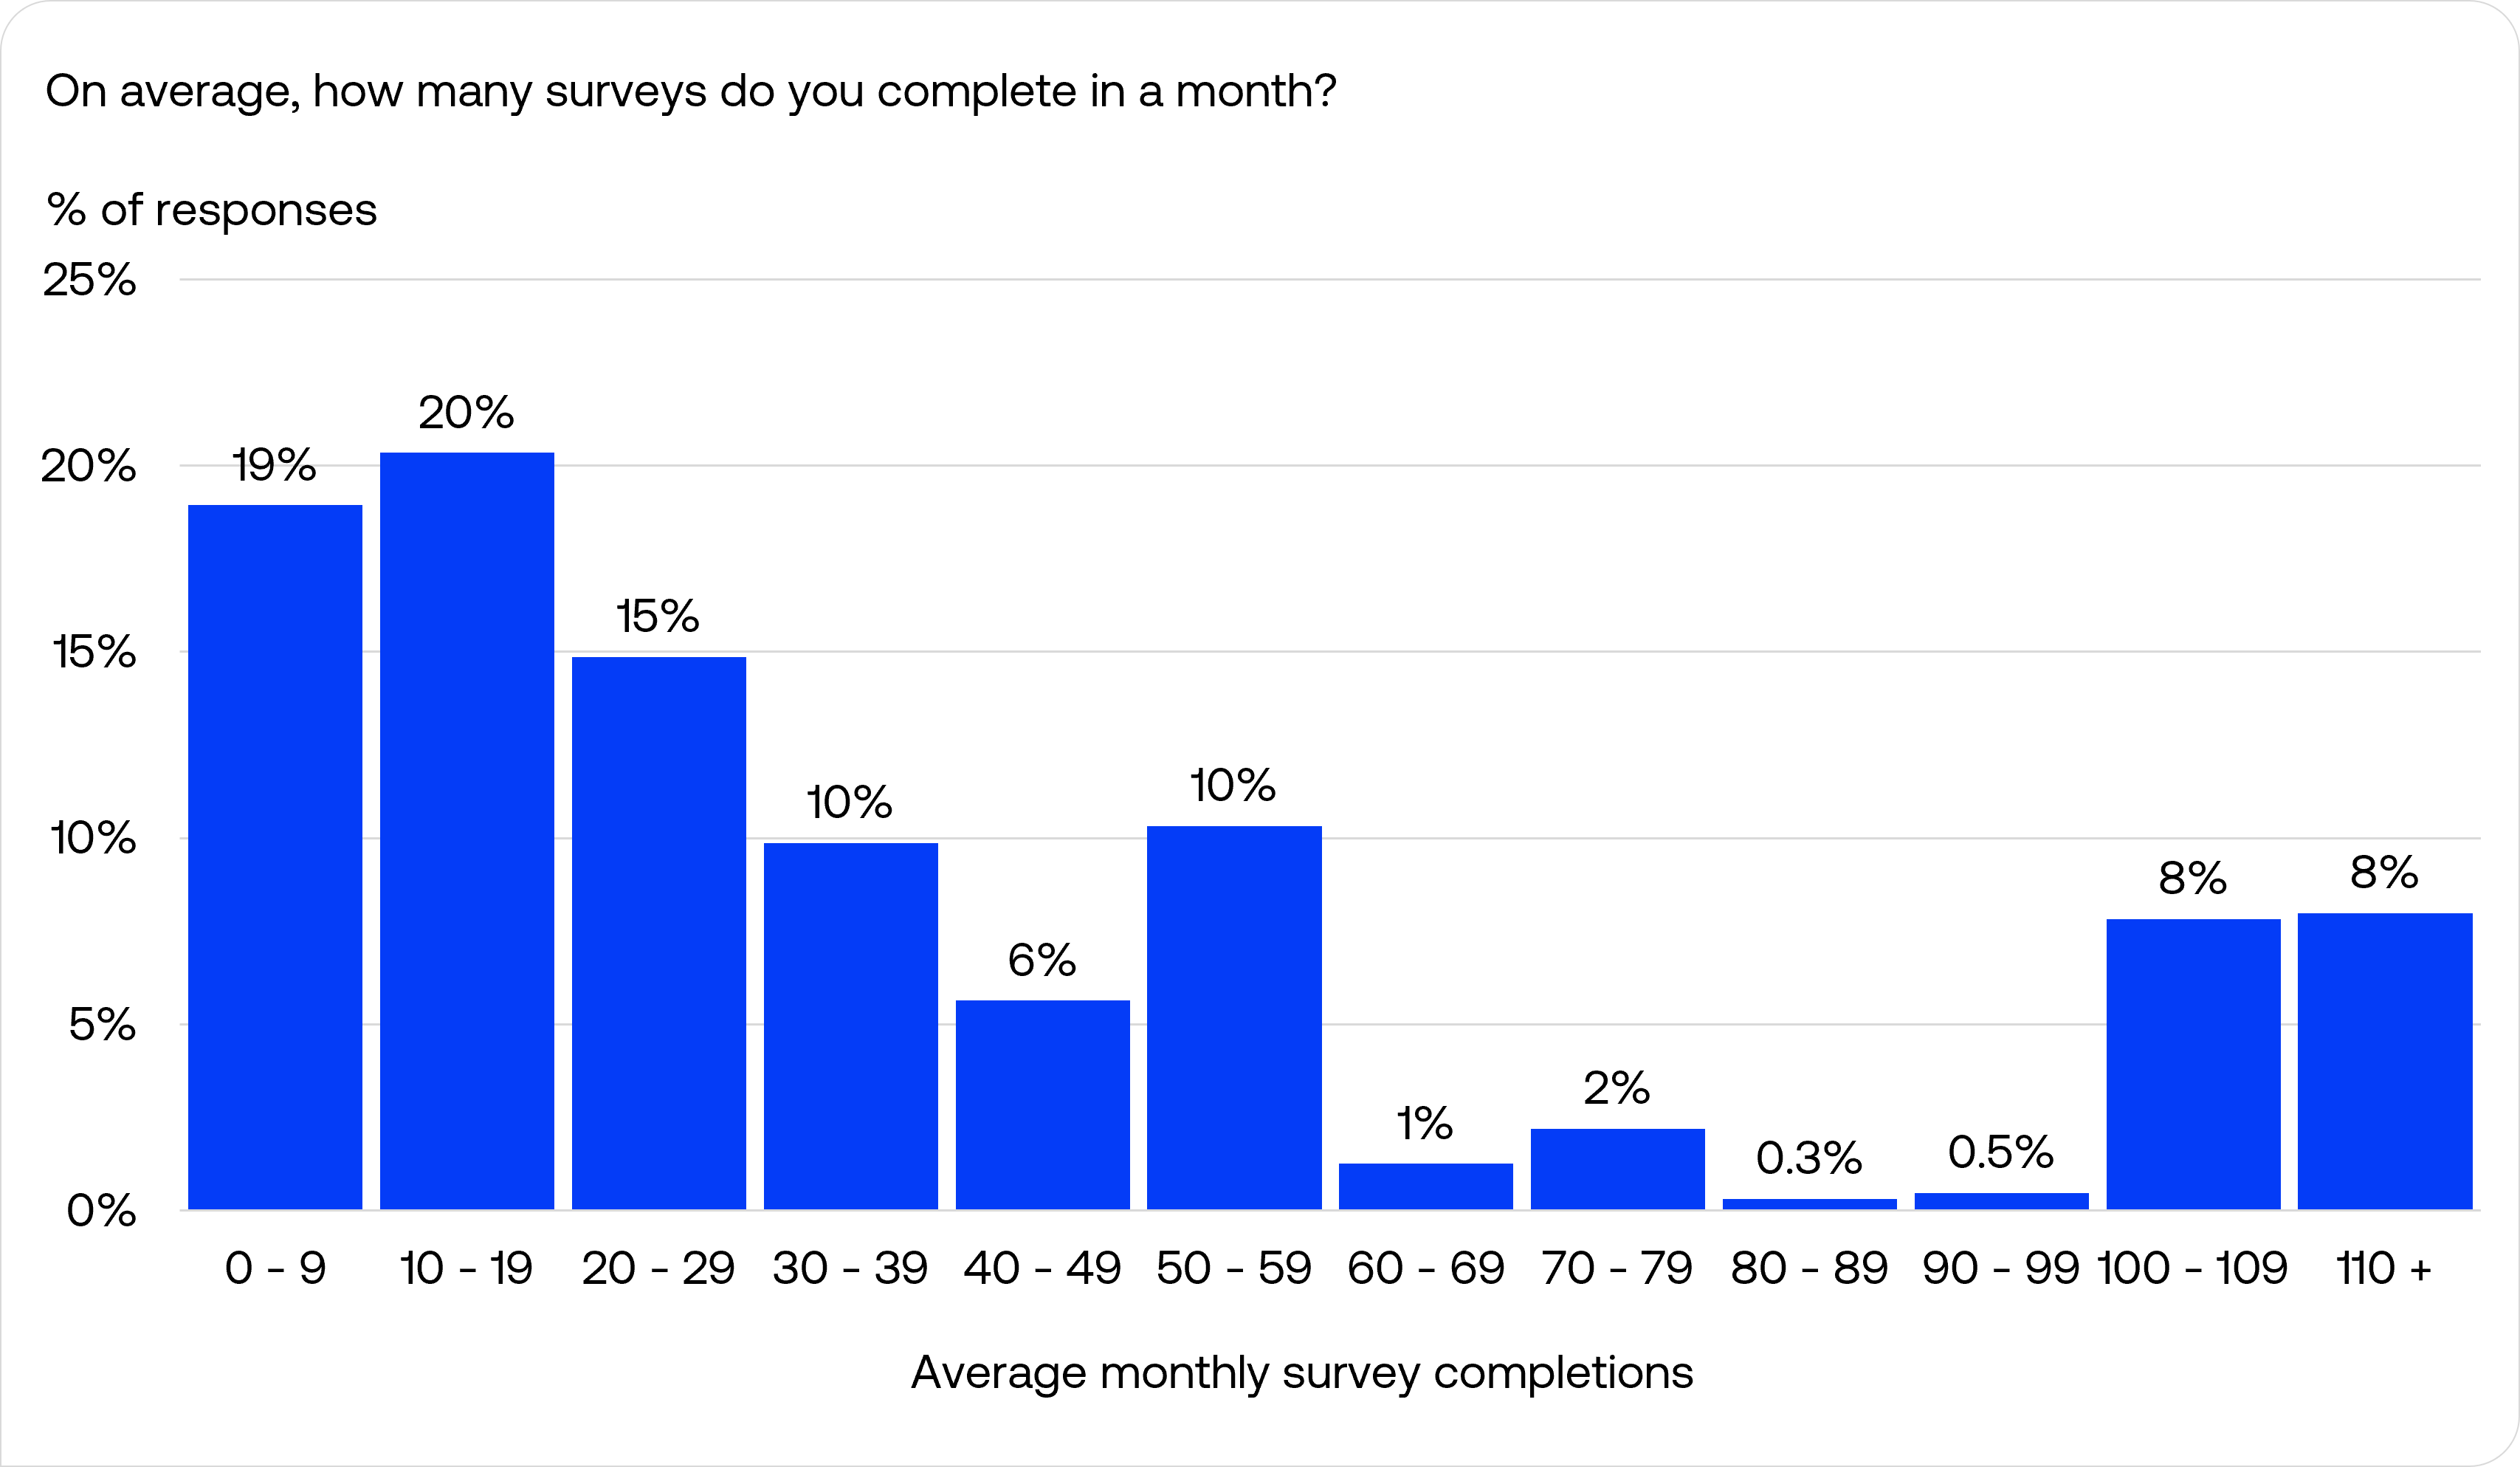
54% of all respondents reported they completed 30 or fewer surveys monthly, with the 10-19 range being the most common frequency (20%), followed closely by 0-9 surveys per month at 19%.
Interestingly, while most panel participants engaged moderately with surveys, there was a segment of more active participants, with 16% reported they completed 100 or more surveys monthly.
The understanding of a “complete” survey probably differs between respondents and researchers. For instance, some respondents may consider a survey as “complete” once they finish the survey with any status, while researchers only consider a survey “complete” if the respondent finishes the survey and is not disqualified.
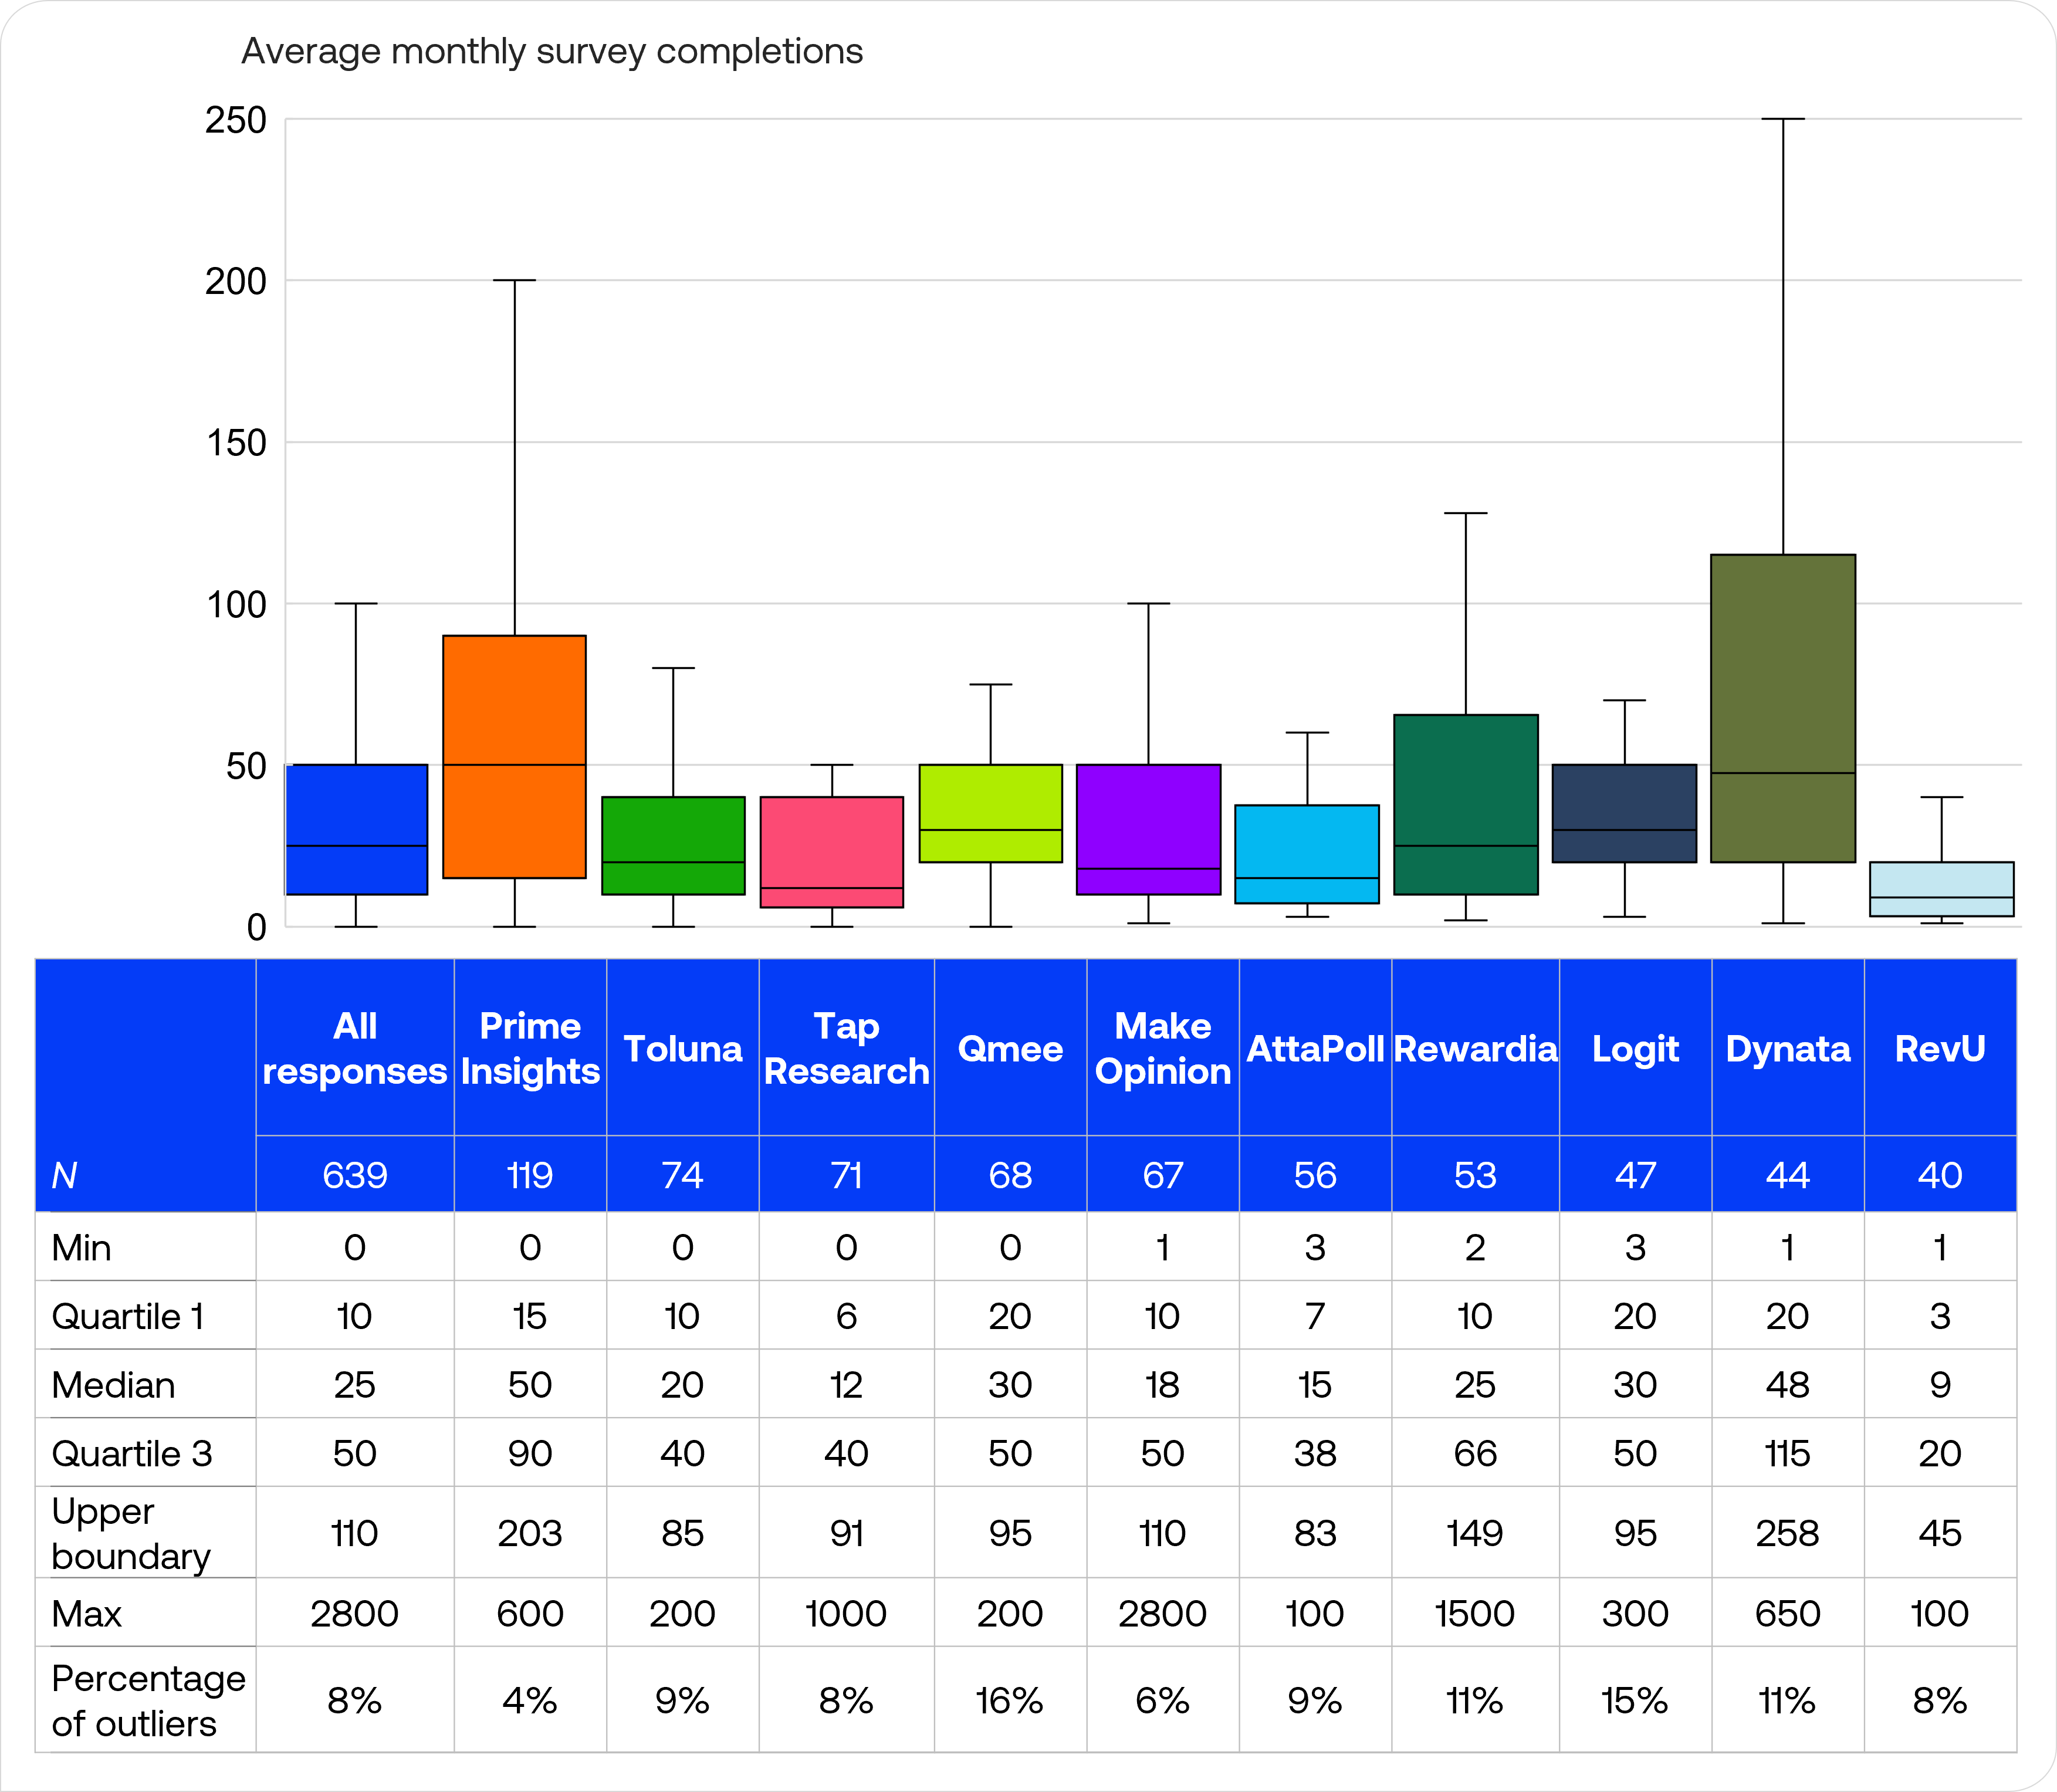
The box plot comparison across panels reveals that most panels displayed a similar pattern of right-skewed distributions, where a few highly active participants completed substantially more surveys than typical members. Respondents from Prime Insights and Dynata had slightly higher median completion rates at 50 and 48 respectively, while those from RevU and Tap Research showed slightly lower completions with median of 9 and 12 survey completions monthly.
Looking at the distribution of responses, participants from Dynata reported the widest spread of typical monthly completions with an interquartile range of 95, suggesting inconsistent survey completion levels among its panelists.
The upper boundary value represents the statistical threshold above which responses were considered outliers (calculated as Q3 + 1.5 × IQR). For instance, while the typical range for Make Opinion extended to 110 surveys monthly, some participants reported much higher values up to 2800.
The percentage of outliers indicates what proportion of each panel’s respondents reported unusually high completion rates. Qmee (16%) and Logit (15%) had slightly higher percentage of statistical outliers, while Prime Insights had a slightly lower outlier percentage than other platforms at 4%.
Average earning per complete survey
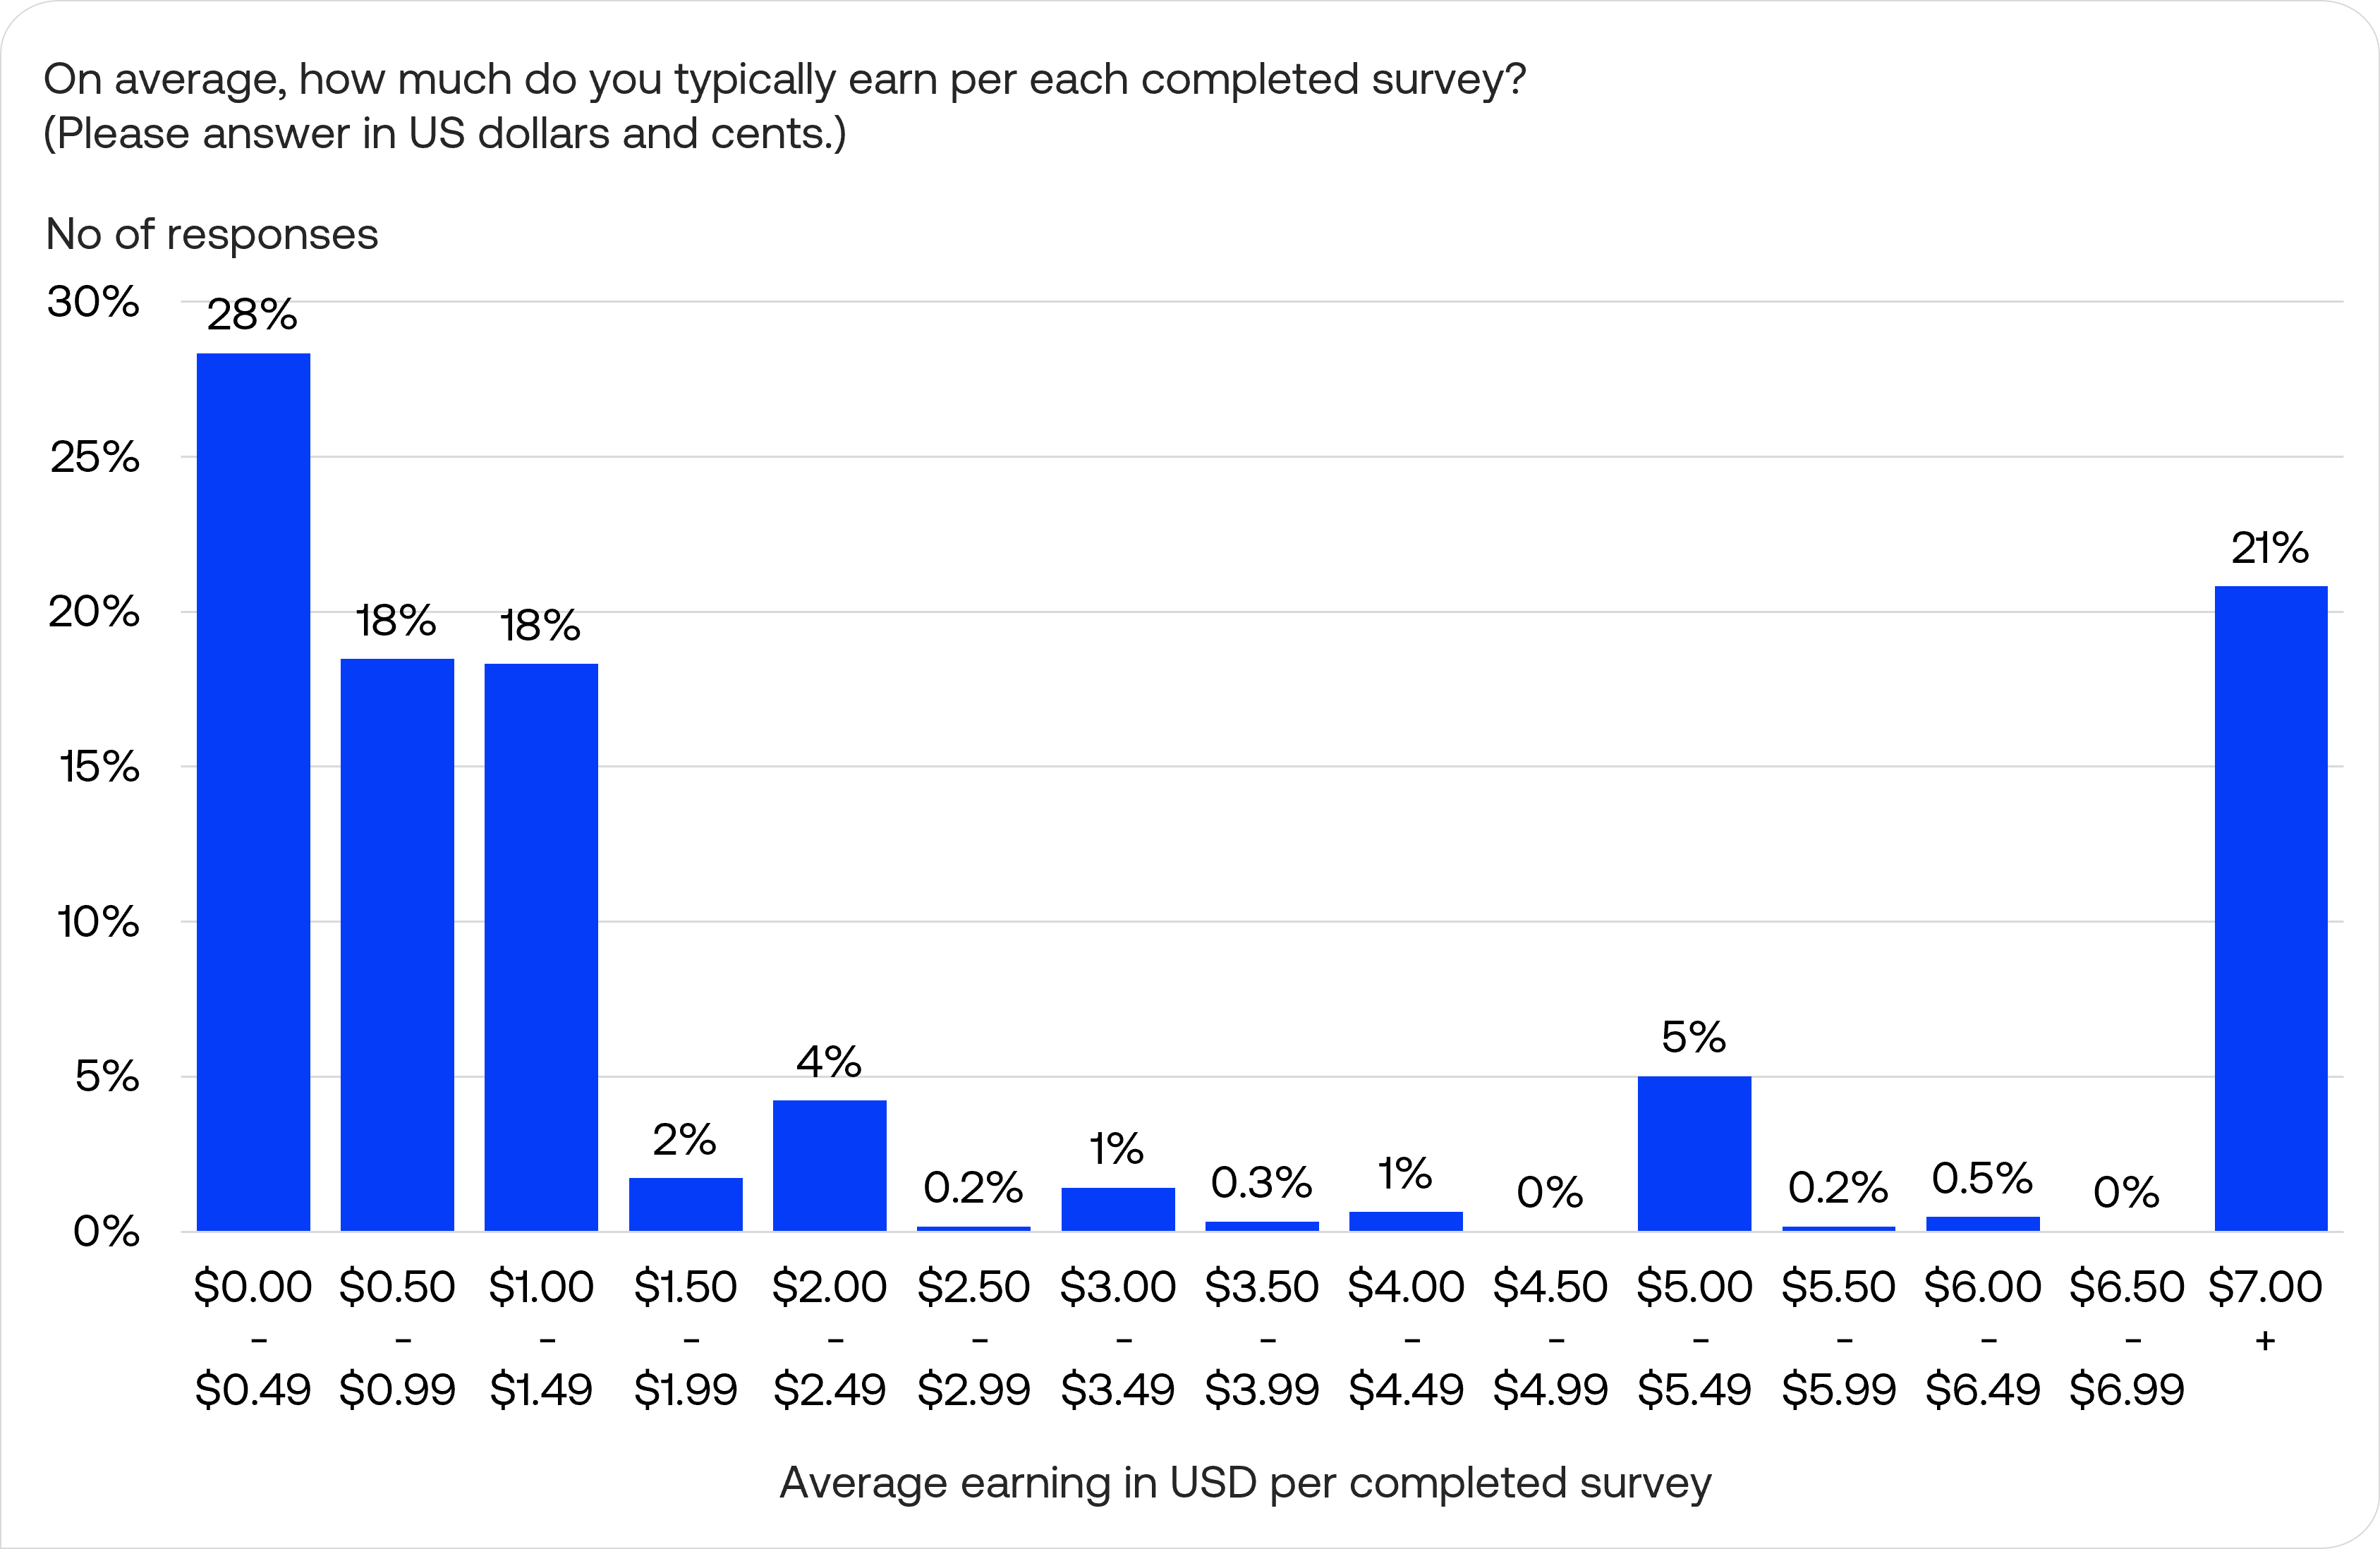
Nearly two-thirds (64%) of participants reported earning less than $1.50 per completed survey, with the $0.00-$0.49 range being the most common (28%). Interestingly, 21% reported earning $7.00 or more per survey, indicating likely overstatement of rewards.
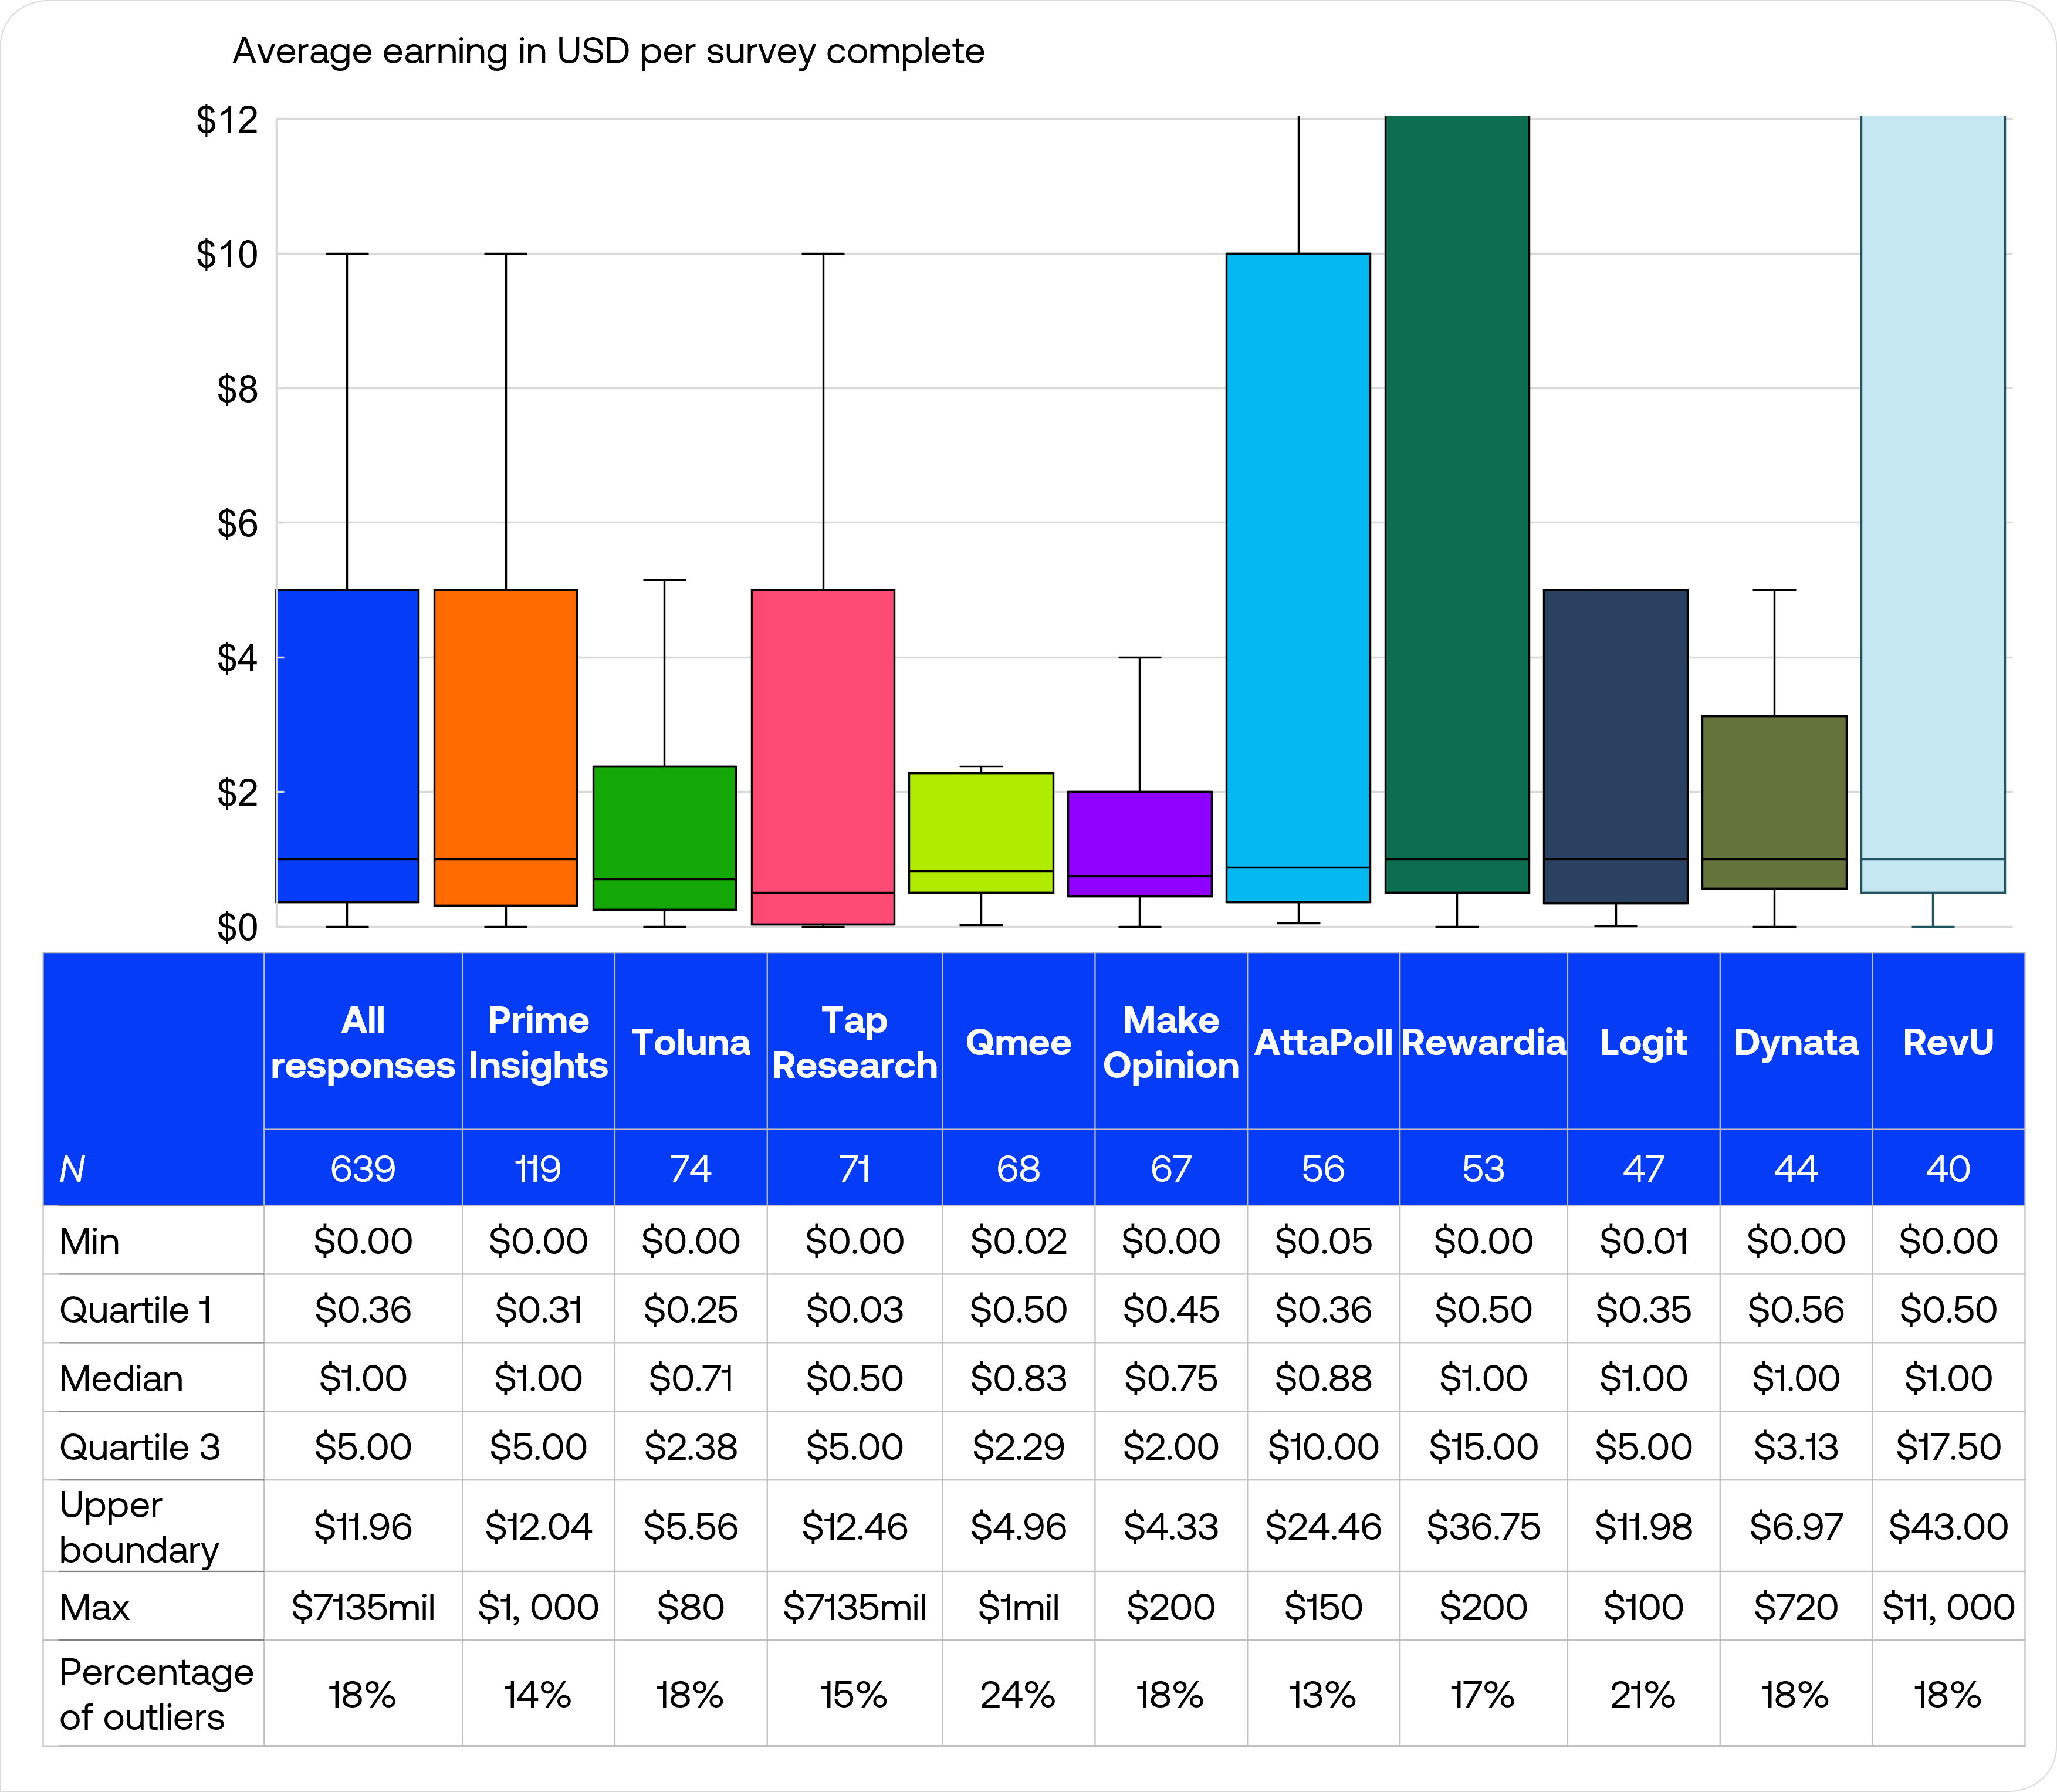
The median reported earnings across all panels was $1.00 per completed survey, with most platforms showed similar median rates between $0.50 and $1.00. However, there was variation in the upper earnings ranges, with respondents from Rewardia and RevU having reported the highest potential earnings (Q3 values of $15.00 and $17.50 respectively).
The distribution of earnings was heavily skewed, with most respondents clustered at lower payment levels but with a long tail extending to much higher reported amounts. All panels showed statistical outliers (ranging from 13% to 24% of responses).
Average monthly earning for completing surveys
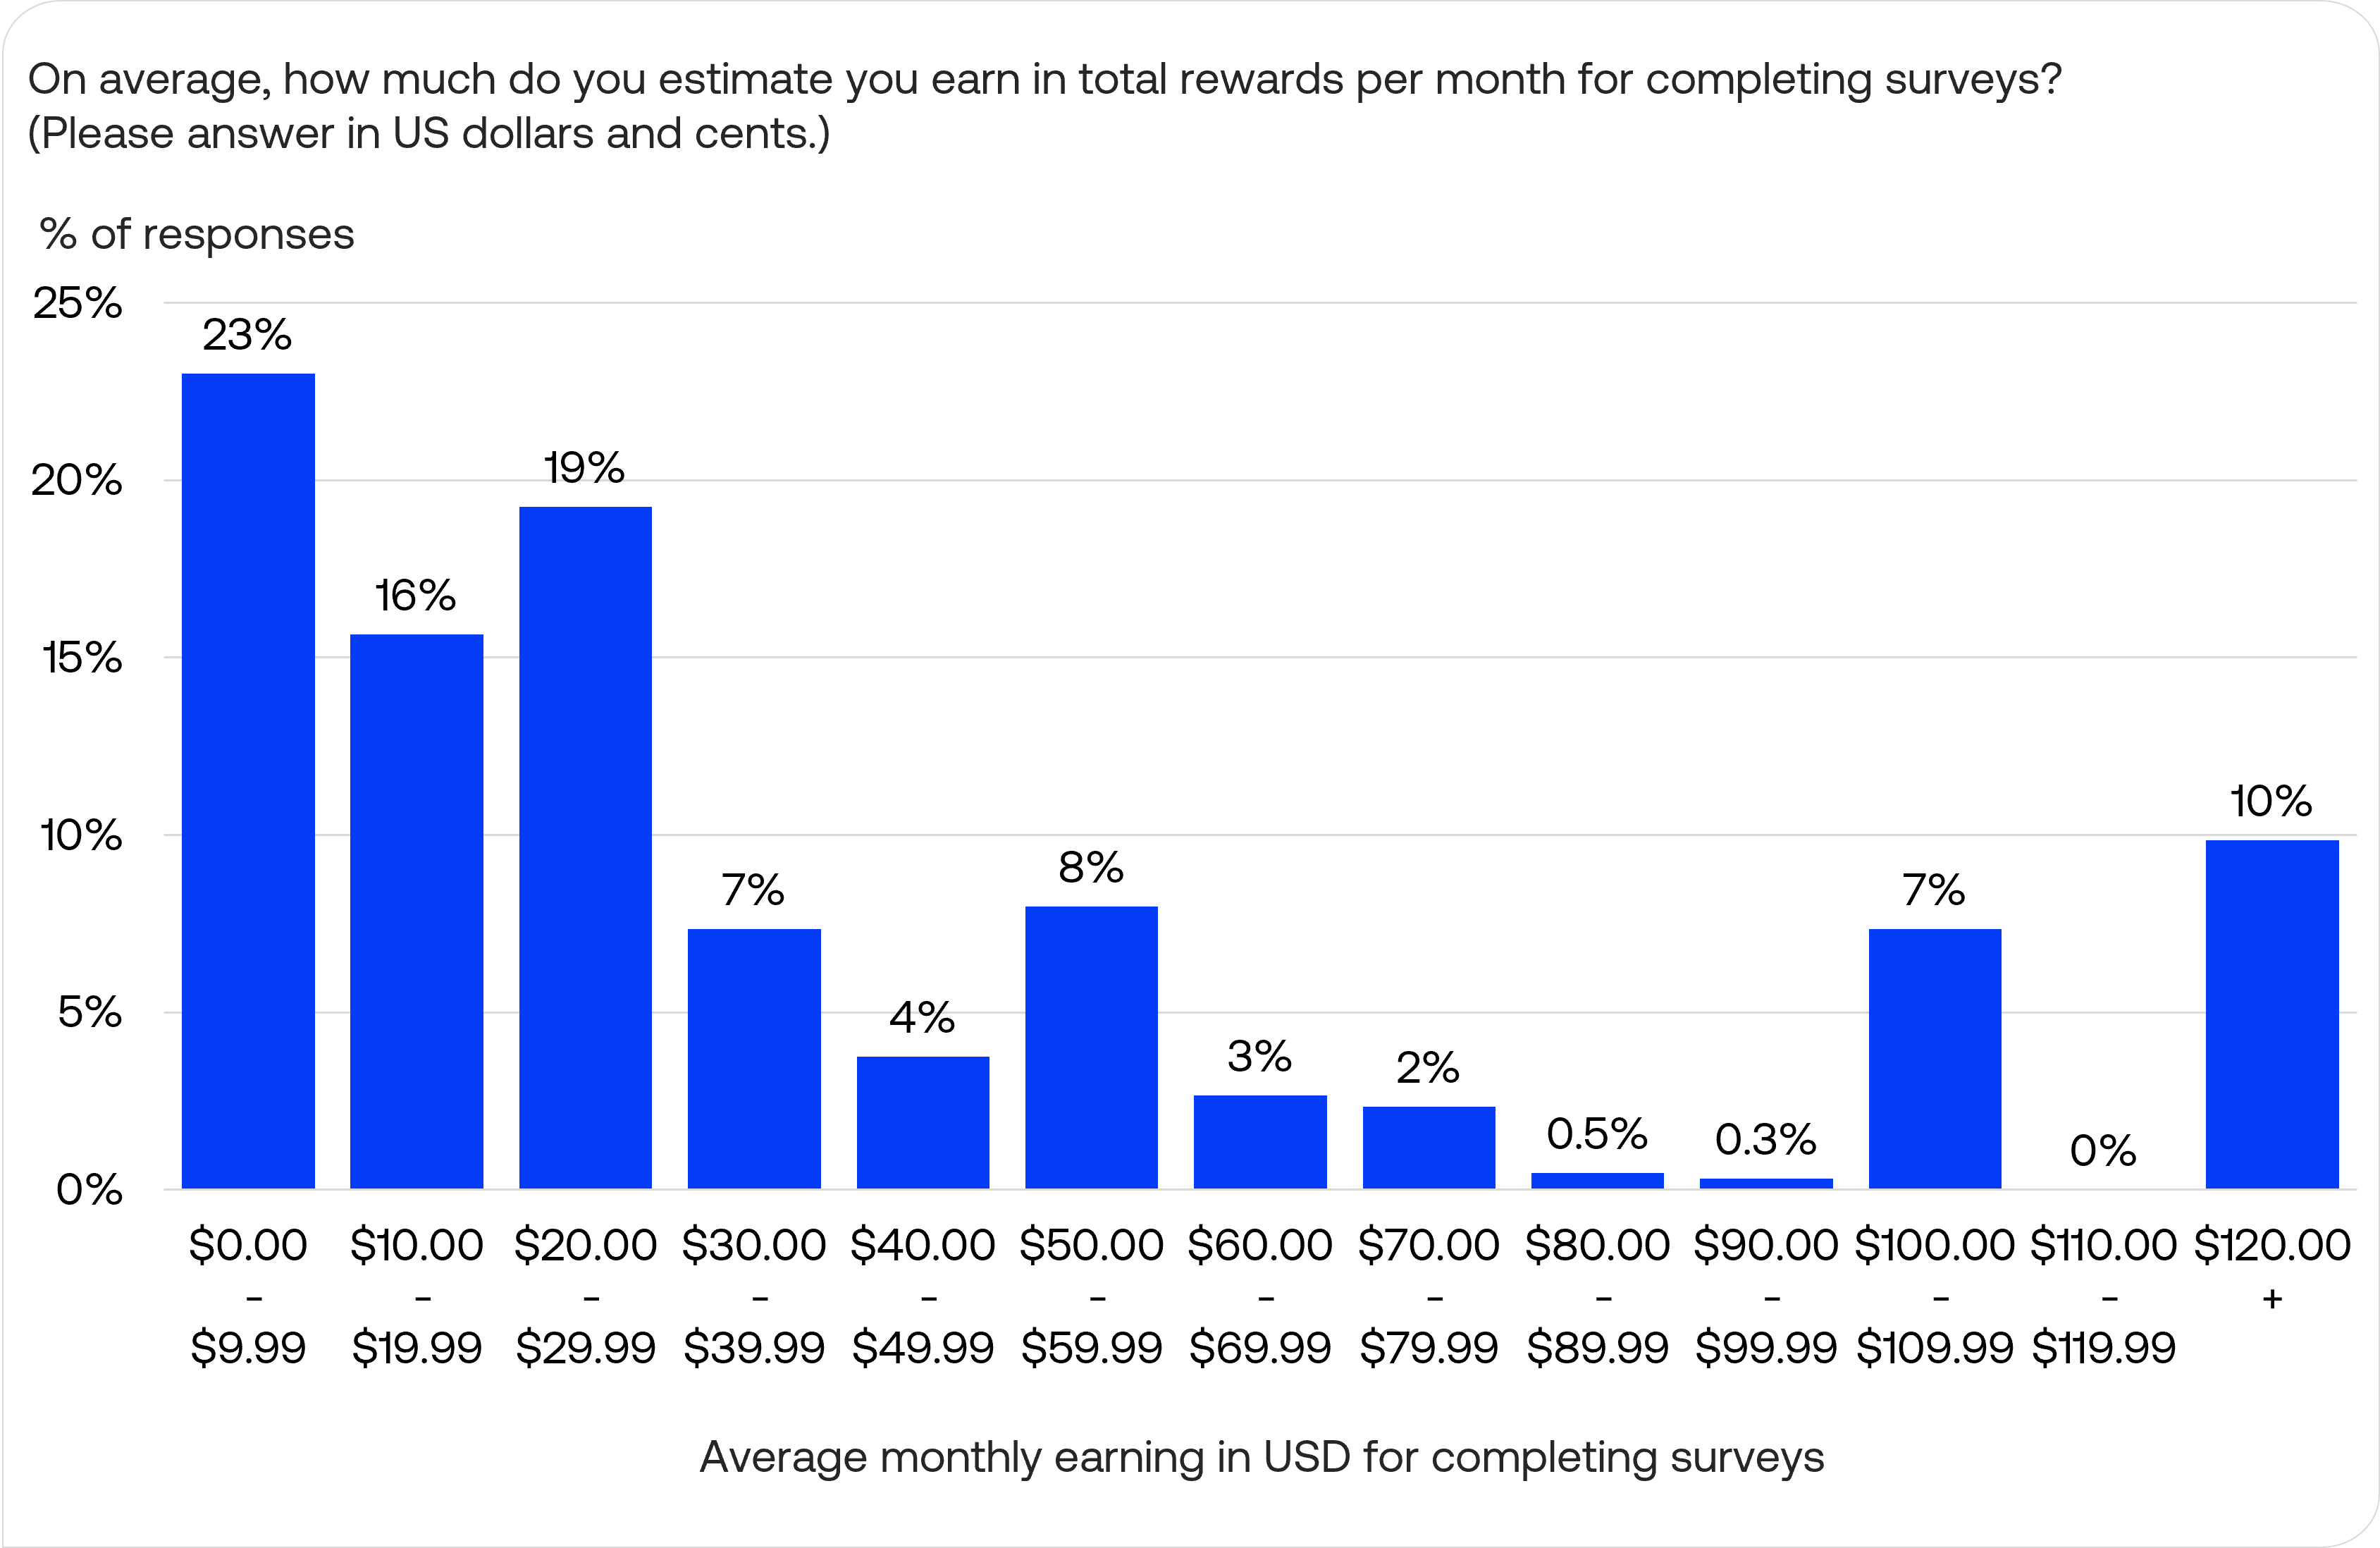
The distribution of average monthly earning for completing surveys showed a long-tail pattern, with earnings clustered in lower earning brackets ($0-$29.99), tapering through the middle ranges ($30-$100) before rising again at the upper end.
370 individuals or 58% of respondents reported less than $30 per month from completing surveys, with the $0.00-$9.99 range being the most common range (23%). There was a notable cluster of respondents (10%) who reported earning $120.00 or more monthly, indicating a segment of more active participants who likely combine higher survey volume with better-paying opportunities.
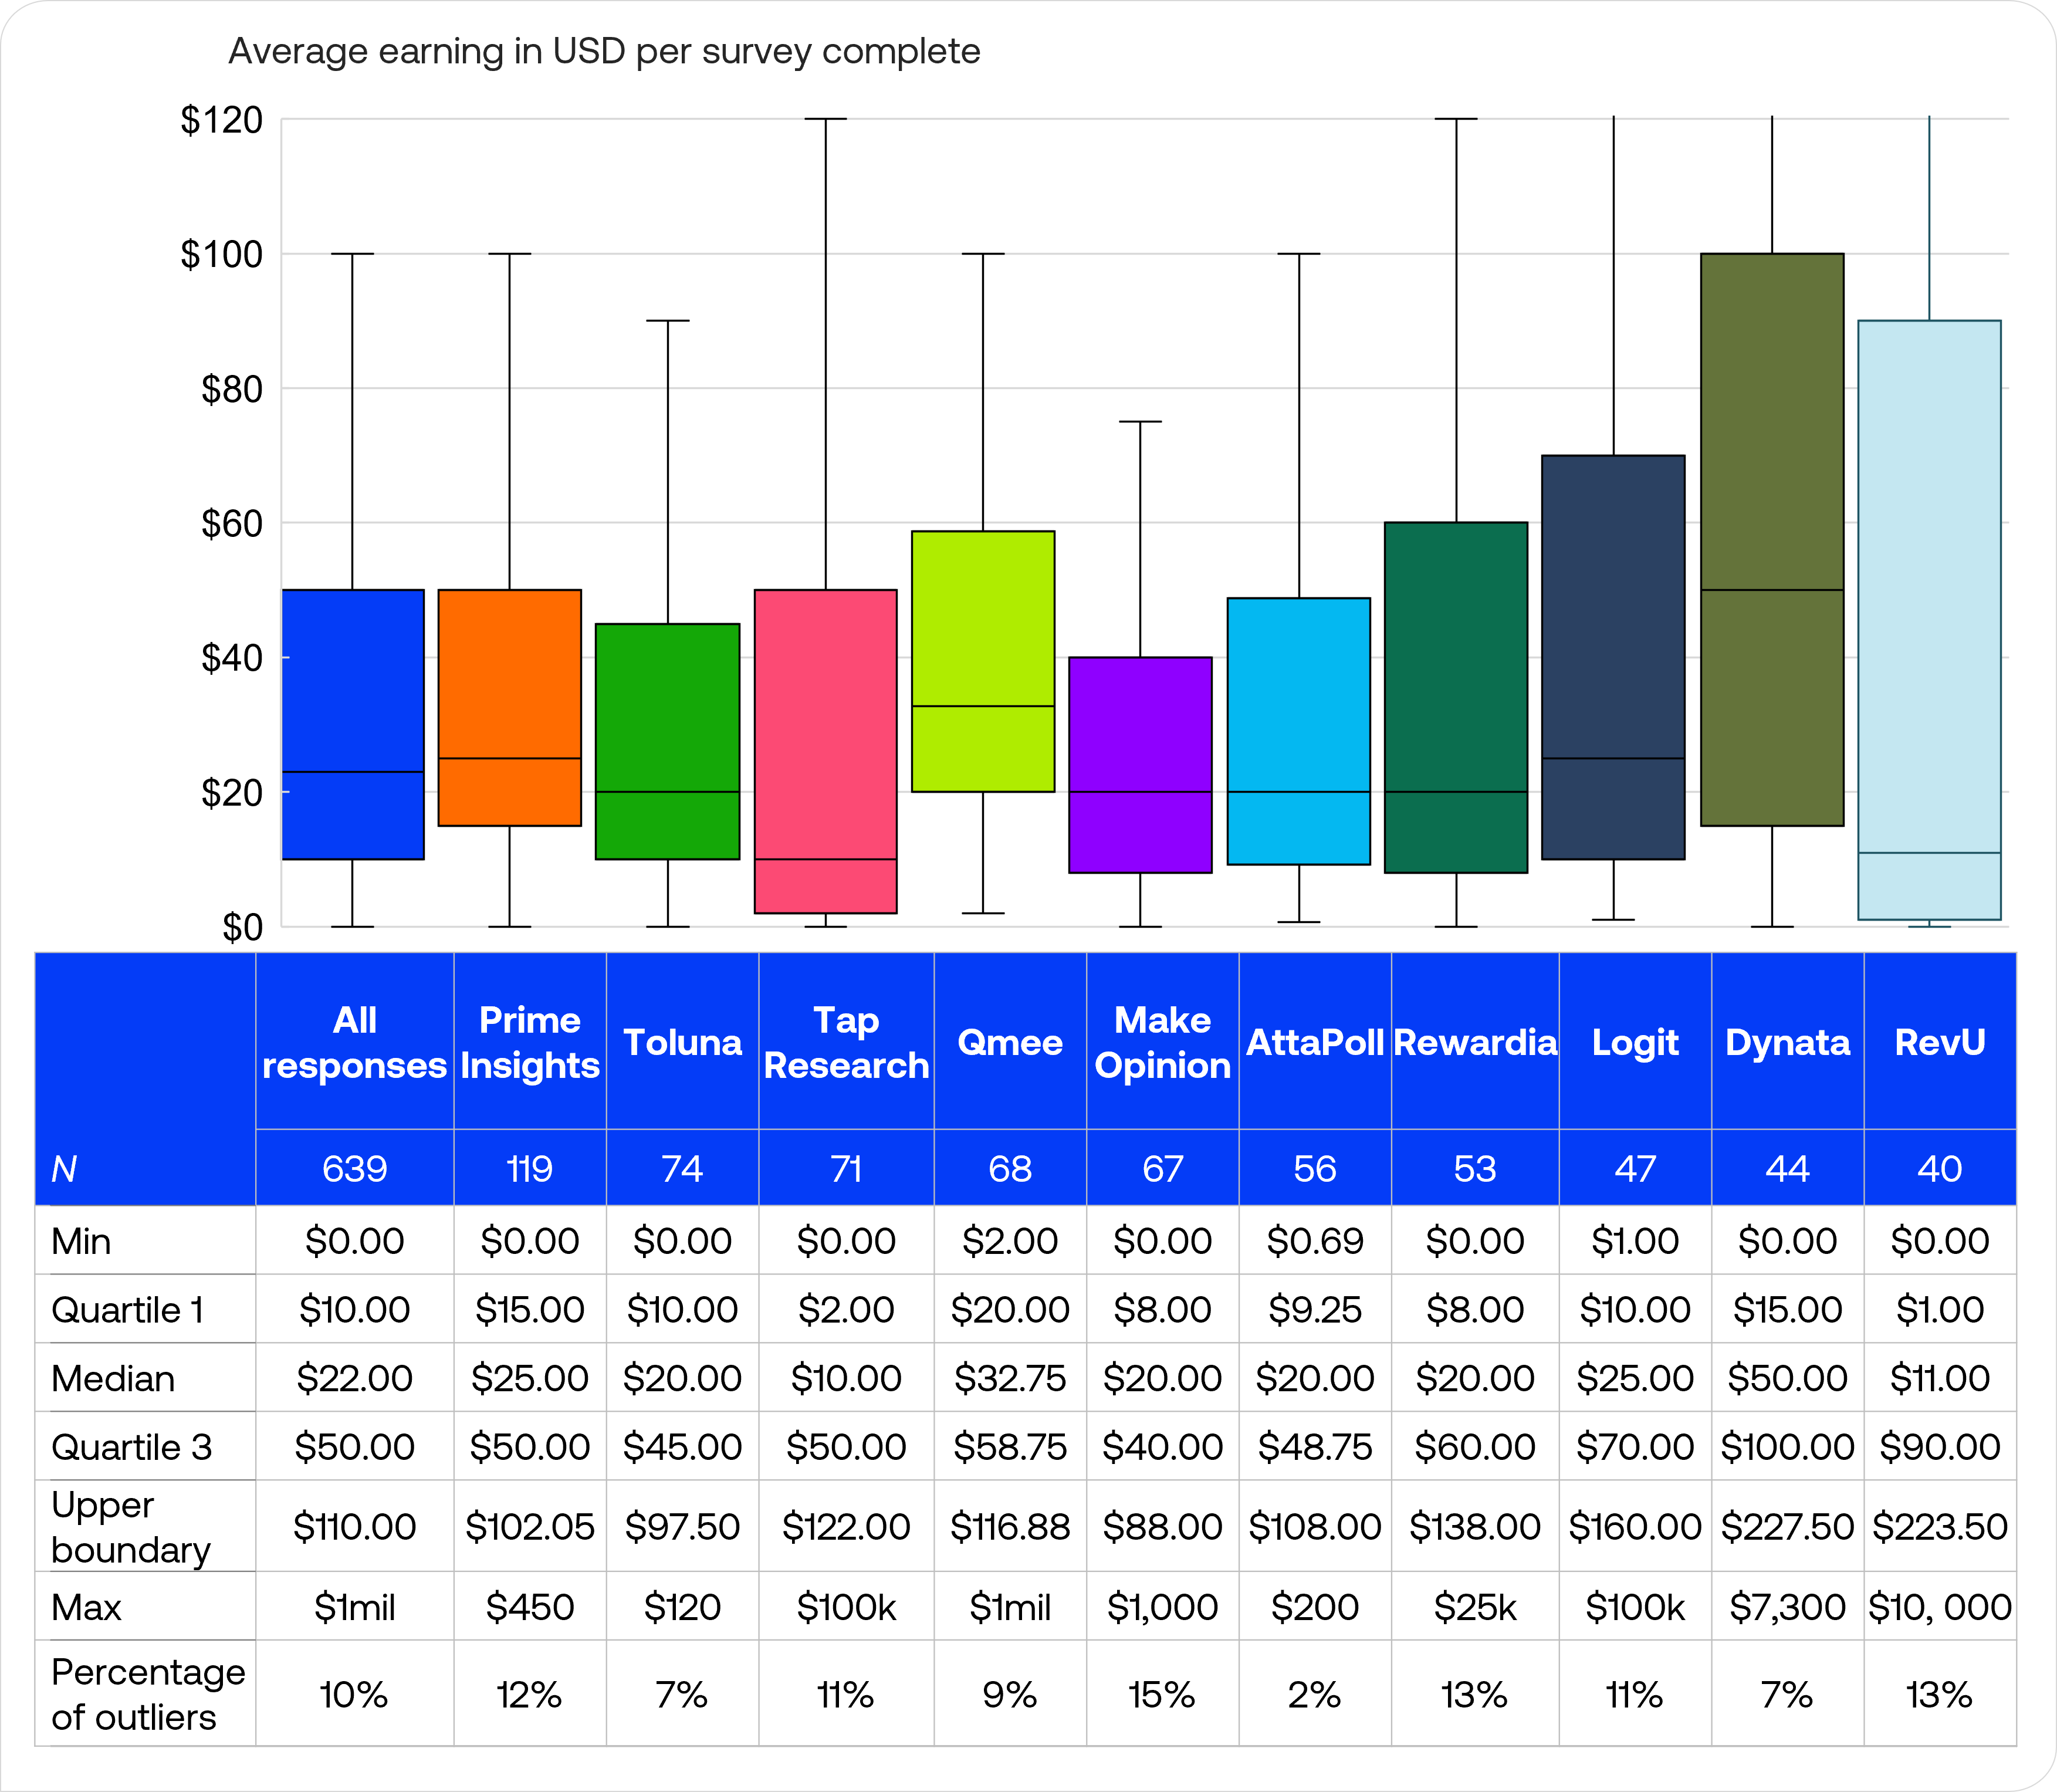
The median monthly earnings across all panels was $22.00, with variation existing between platforms. Respondents from Dynata reported the highest median monthly earnings of $50.00, while RevU and Tap Research showed the lowest median earnings ($11.00 and $10.00 respectively).
Looking at the potential for higher earnings, Dynata, Logit, and RevU showed slightly higher upper quartile values ($100.00, $70.00, and $90.00). Respondents from Qmee reported the most consistent earnings pattern, with the narrowest interquartile range.
Most panels reported similar outlier percentages between 7% and 13%, with Make Opinion having recorded the highest proportion of statistical outliers at 15% and AttaPoll achieved comparatively lower rate at 2%.
Open-ended feedback
The open-ended feedback reveals several consistent concerns across panels:
- Compensation issues:
- Many respondents want higher pay for surveys
- Frustration with not receiving rewards for completed surveys on time
- Desire for compensation even when disqualified
- Surveys taking longer than estimated
- Survey qualification problems:
- Frequent disqualification, often after spending significant time on a survey
- Wish for earlier/quicker disqualification if not eligible
- Unnecessarily repeated demographics questions
- Technical issues:
- Surveys crashing, freezing, or having errors
- Mobile compatibility problems
Some respondents have positive experiences, including:
- Some users say that their panel app/website easy to use
- Appreciation for quick payouts and low cash-out thresholds
- Enjoyment of sharing opinions and earning money
Suggestions included:
- More surveys tailored to user interests/demographics (i.e. so that respondents are not disqualified based on already answered questions like demographics)
- Clearer progress indicators (e.g. progress bars) to show how much of the survey is left
- Better vetting of survey authors to prevent perceived scams where participants are not compensated for their time (which points to overly stringent disqualification criteria from researchers)
Overall, the feedback indicates both positive experiences and areas for improvement, with compensation and qualification issues being the most prominent concerns.


