
Key Driver Analysis reveals which factors have the strongest influence on customer satisfaction, purchase intent, or other business outcomes, helping you prioritise where to focus for the biggest improvement.
What is Key Driver Analysis
Key Driver Analysis is a research method for measuring how much different factors influence business outcomes like customer satisfaction, purchase intent, or loyalty.
It uses statistical techniques to calculate each factor’s relative contribution, helping you identify which factors have the strongest influence on a business outcome.
This method is especially useful when performance is lacking across multiple factors and you can’t improve everything at once.
The core question Key Driver Analysis answers: “Considering all factors that influence our key business metric, which ones should we prioritise to achieve the biggest improvement?”
The analysis categorises factors into four groups based on importance and current performance:
Importance
| High | Improvement priorities | Current strengths |
|---|---|---|
High importance, weak performance
| High importance, strong performance
| |
| Low | Lower priority areas | Potentially over-investment |
Low importance, weak performance
| Low importance, strong performance
| |
| Weak | Strong | |
| Performance | ||
How Key Driver Analysis differs from conjoint analysis
Both Key Driver Analysis and conjoint analysis measure what matters to customers, but they approach the question differently and suit different business scenarios.
Key Driver Analysis examines existing experiences. Respondents rate their satisfaction with current product attributes, and the analysis reveals which attributes statistically influence outcomes like Net Promoter Score or purchase intent. It works well for optimising existing products or services (i.e. those that are on the market or consumers already have experienced themselves) when you already have a list of potential drivers and want to prioritise improvement areas.
In comparison, conjoint analysis evaluates trade-offs between features. Respondents choose between product concepts or profiles, revealing the relative value they place on different feature combinations. It works well for product and pricing adjustments, evaluating new (including unreleased) offerings, and understanding price sensitivity.
The table below summarises the key differences:
| Comparison | Key Driver Analysis | Conjoint analysis |
|---|---|---|
| Inputs | Rating scales (satisfaction, Likert scales) for product attributes | Forced choices between product concepts or profiles |
| Importance | Statistical influence on an outcome metric (e.g., NPS) | Utility derived from making trade-offs between features |
| Question | Which attribute explains the most variance in our key metric? | What is the value of one feature level relative to another? |
| Use case | Prioritising improvements in existing products or services | Designing new products, features, or pricing strategies |
Questions to ask in a Key Driver Analysis survey
Key Driver Analysis requires a clear dependent variable (e.g. overall satisfaction, likelihood to recommend, or purchase intent) paired with independent variables that potentially drive the outcome.
Outcome measure
Include at least one question measuring the overall business metric you want to improve. Common choices include:
- Overall satisfaction: “How satisfied are you with [product/service]?”
- Net Promoter Score: “How likely are you to recommend [product] to others?”
- Purchase intent: “How likely are you to purchase [product]?”
- Likelihood to renew or continue using: “How likely are you to continue using [product]?”

Attribute performance questions
Include questions which ask respondents to rate their satisfaction or agreement with specific product or service attributes. Use consistent rating scales across all attributes.
Examples for a hotel:
- “How satisfied are you with room cleanliness?”
- “How satisfied are you with staff friendliness?”
- “How satisfied are you with location?”
- “How satisfied are you with value for money?”
Case study: Key drivers of customer loyalty for cornflakes
A cornflakes brand surveyed 241 consumers to identify which product attributes most influence customer loyalty, measured through Net Promoter Score.
Attributes tested
Twelve product attributes across four categories, namely sensory attributes, product quality indicators, brand and value perceptions, and functional attributes were measured as potential satisfaction drivers.
Each attribute was assessed individually on a 5-point Likert scale (1 “very poor” to 5 “excellent”) as follows:
- Sensory attributes:
- Flavour satisfaction
- Crispiness satisfaction
- Overall mouthfeel satisfaction
- Product quality indicators:
- Sugar content level satisfaction
- Overall nutritional value satisfaction
- Consistency between boxes
- Brand and value perceptions:
- Brand trustworthiness
- Value for money
- Functional attributes:
- Retail availability
- Fit with dietary requirements
- Packaging freshness preservation
- Ease of opening and pouring
Results
The tested attributes explained 58% of variation in NPS scores, indicating strong model fit. The analysis model captures most key drivers, though some factors influencing loyalty remain outside this analysis.
Breaking down this explainable variance by individual driver, flavour emerged as the most dominant driver with 32% of the explainable variance in NPS. The next three drivers were sugar content (12%), nutritional value (8%), and mouthfeel (8%). These top four attributes together account for 61% of explainable variance.

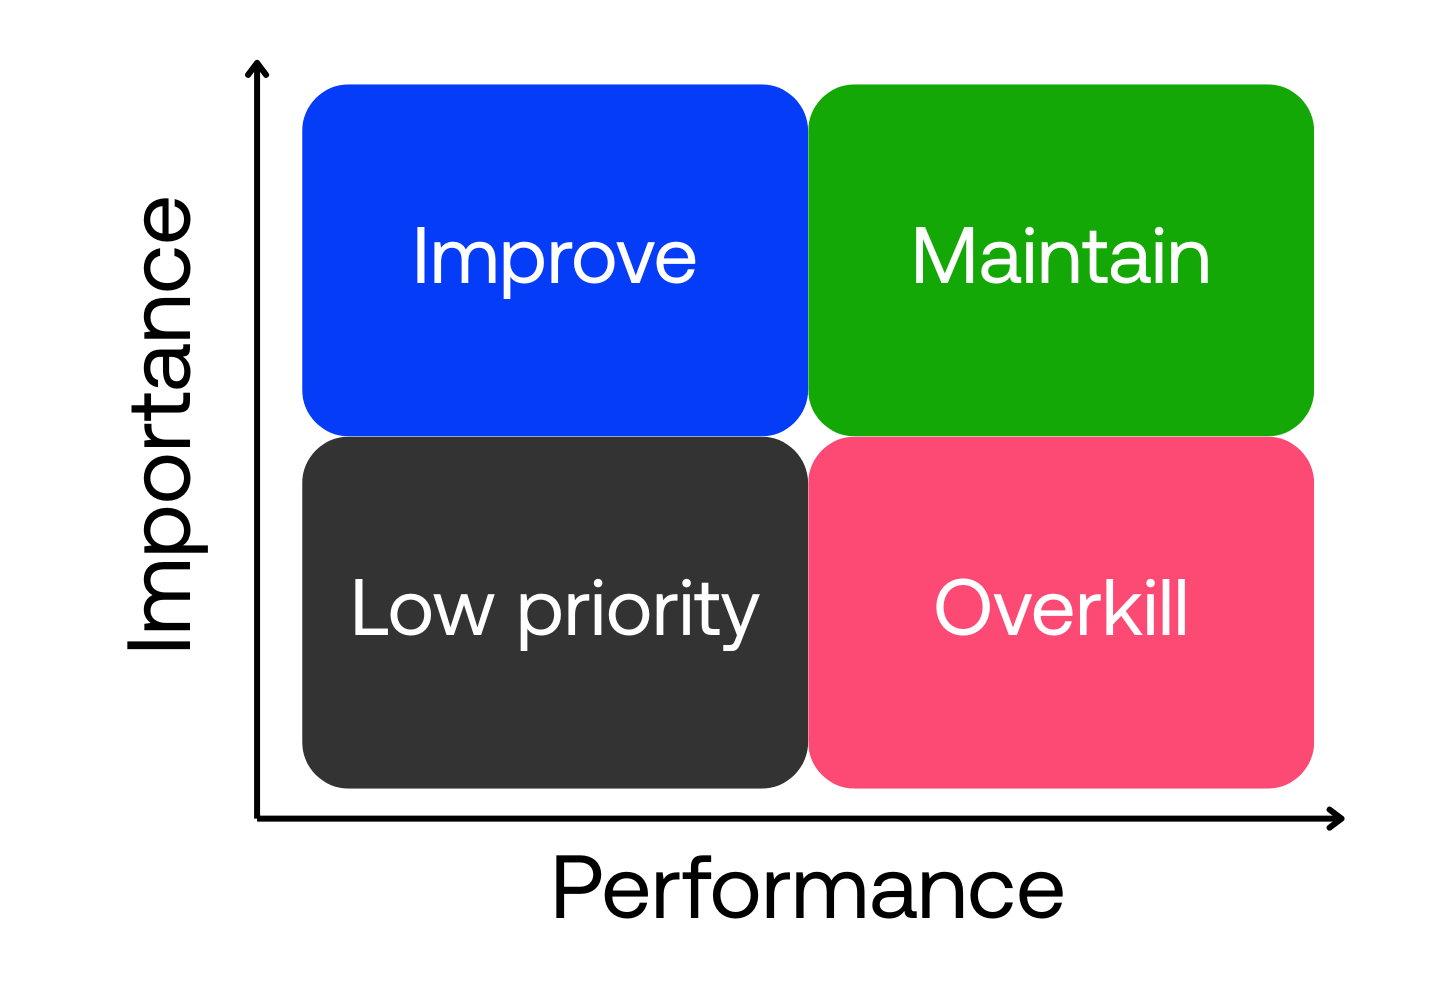
Visualising results through importance-performance matrix
Key Driver Analysis results can be transformed into a two-dimensional grid that maps importance against performance for each attribute, where:
- The vertical axis shows importance, measured as the percentage contribution each factor makes to the explainable variance in your outcome metric. Higher positions indicate stronger influence on results.
- The horizontal axis shows performance, calculated as the mean satisfaction rating or top-2-box percentage for each attribute. Further right means customers rate that attribute more positively.
This creates four strategic quadrants:

Importance
| High | Improvement priorities | Current strengths |
|---|---|---|
High importance, weak performance Flavour, sugar content, mouthfeel, and crispiness are important attributes that drive NPS but underperform, making them the primary improvement targets. | High importance, strong performance Nutrition and brand trust represent strengths to maintain, as both are high-importance attributes where the product performs well. | |
| Low | Lower priority areas | Potentially over-investment |
Low importance, weak performance Mouthfeel, crispiness, dietary needs, consistency, packaging, and value for money show room for improvement. However, their low importance makes them secondary concerns. | Low importance, strong performance Availability and ease of use perform well but contribute minimally to loyalty. Resources here might deliver better returns if redirected to flavour improvements. | |
| Weak | Strong | |
| Performance | ||
Best practices for effective Key Driver Analysis
Follow these guidelines to get reliable, actionable results from your Key Driver Analysis.
1. Use consistent rating scales during survey design
All attribute ratings should use similar scales (e.g. 7-point) for meaningful comparisons. Mixed scales require additional data preparation that can introduce complexity.
2. Match specificity levels across attributes
Compare high-level concepts together (e.g. quality, service, value) or specific features together (e.g. loading Speed, navigation, search function). Avoid mixing both types in one analysis.
3. Check for response variance before analysis
Key Driver Analysis relies on regression models, which may fail to detect the true importance of attributes when response variance is low. Review standard deviations and distributions first, then remove low-variance attributes before analysis.
4. Screen for data quality issues
Identify and remove problematic responses like straight-lining (i.e. selecting the same answer for all questions) or random patterns. Poor quality data distorts importance scores and produces unreliable conclusions.
5. Include open-ended questions for complete insights
Key Driver Analysis measures only the attributes you test. Add open-ended questions like “What else influences your satisfaction?” to capture important drivers outside your framework and provide context for statistical results.
Run Key Driver Analysis with Conjointly
Key Driver Analysis delivers its highest value when the study design matches your business context. The questions you ask, how you frame attributes, and which outcome measures you select determine whether results translate into actionable insights.
Conjointly’s research team handles the complete process as a custom project. This includes designing the survey framework, selecting appropriate statistical methods, ensuring data quality, and delivering results.
The custom approach means your analysis addresses your specific business questions rather than fitting into a standardised template. Book a call to discuss your objectives and launch your study today.