
Deciding which product options to add, keep, or drop? This guide covers 3 simple steps from building your survey to analysing the results so you can choose a product range that maximises customer appeal.
TURF Analysis Simulator
Conduct automated TURF analysis on results of any Conjointly experiment (or an outside dataset) using this user-friendly TURF analysis tool.
Whether you are adding new product variants or trimming underperforming SKUs, the ultimate goal is to ensure your final lineup appeals to the largest possible audience.
That is precisely what TURF (Total Unduplicated Reach and Frequency) analysis is built for. It identifies the exact combination of items that reaches the maximum number of unique buyers with the least overlap between variants.
While the mathematics behind TURF are complex, Conjointly does all the heavy lifting for you. In three simple steps, you can take a shortlist of product candidates and transform it into a clear, actionable plan showing which products to launch, which to skip, and in what order, with no manual calculations and no complex setup required.
Step 1: Set up a study to gather individual preference data
To ensure your final product lineup appeals to as many customers as possible, you first need data on individual choices, that is who is choosing what.
One effective and efficient way to collect this individual-level preference data is through a Product Variant Selector (PVS) study. Respondents evaluate different concept variations, such as pack sizes, visual designs, or flavours, and choose the option they would buy.
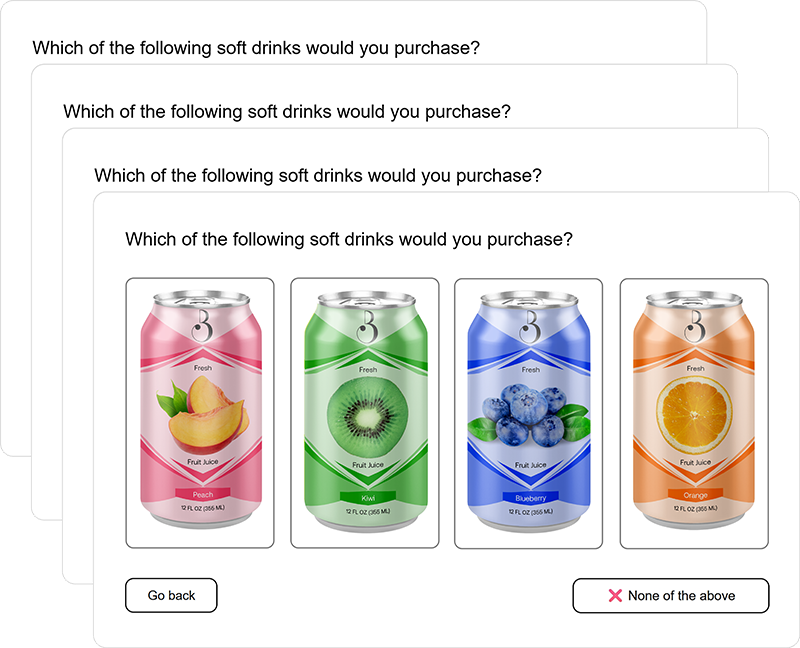
By analysing these choices, PVS generates individual preference scores for each variant and helps you uncover:
- The top-performing individual concepts ranked by customer preference.
- The underlying choice patterns showing which products appeal to the same buyers and which attract entirely new segments.
- The optimal product combinations and launch sequence, maximising overall customer appeal through TURF analysis.
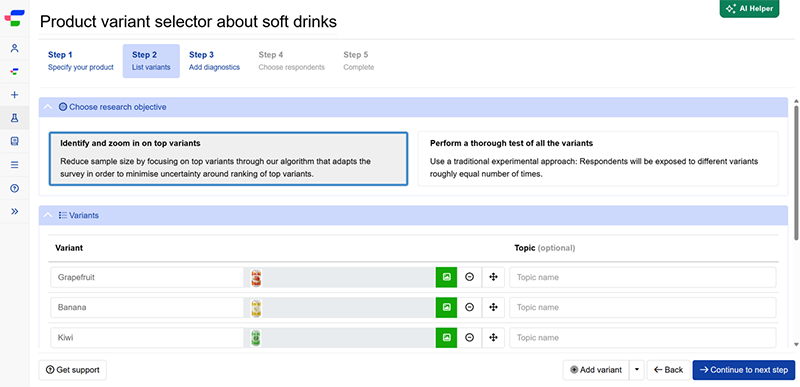
Even with no prior research experience, setting up your study in Conjointly takes just 10 to 30 minutes using the ready-to-launch PVS experiment template. The guided wizard walks you through three quick steps:
- Specify your product: Add your product name and a clear description so respondents understand what they are evaluating.
- List your variants: Input your candidate SKUs, current lineup, or competitor products, with options to add packshots or set up adaptive testing.
- Add diagnostics: Include 3 to 7 follow-up questions, such as purchase intent or uniqueness, to gain deeper consumer insights.
For a complete step-by-step walkthrough, check out the detailed PVS setup guide.
While PVS is an effective and efficient method for testing product variants, you can also run TURF analysis using data from Claims Tests, Conjoint studies, or your own existing survey datasets.
Step 2: Collect your data
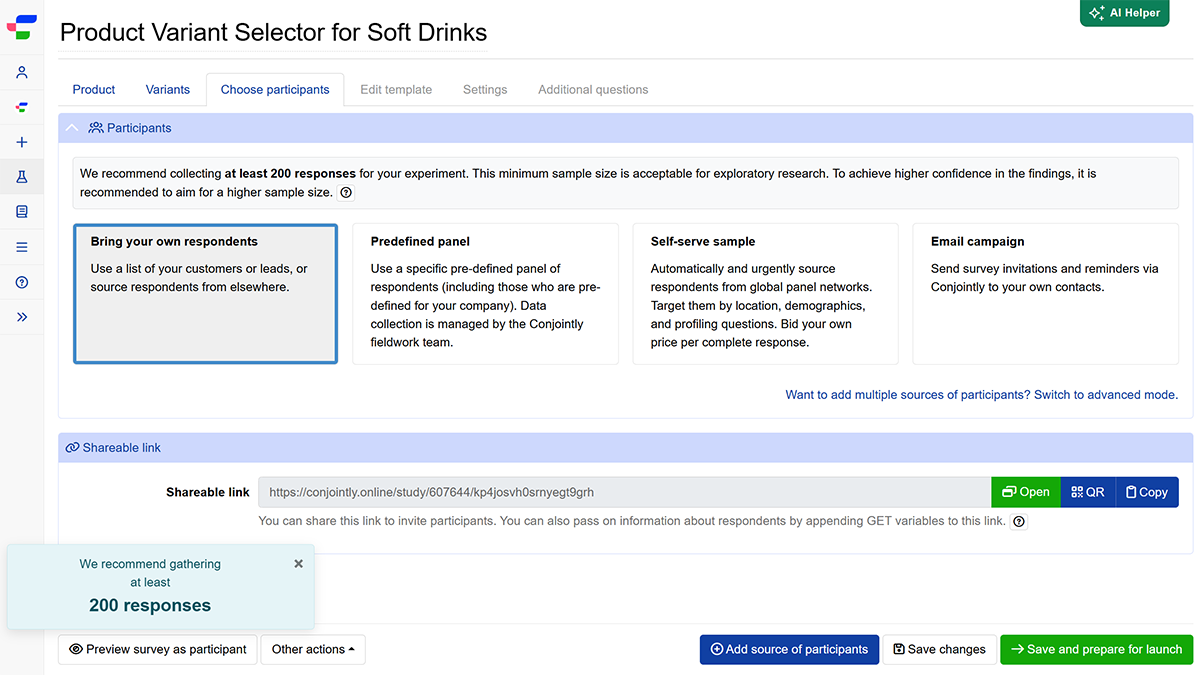
As you set up your study, the platform automatically calculates a recommended minimum sample size for statistically robust results.
You can bring your own respondents from your CRM by sharing your survey link, or use the Email campaign option to send invitations and reminders to your contacts directly from Conjointly.
In addition to your existing audience, Conjointly provides options to include high-quality respondents in your survey.
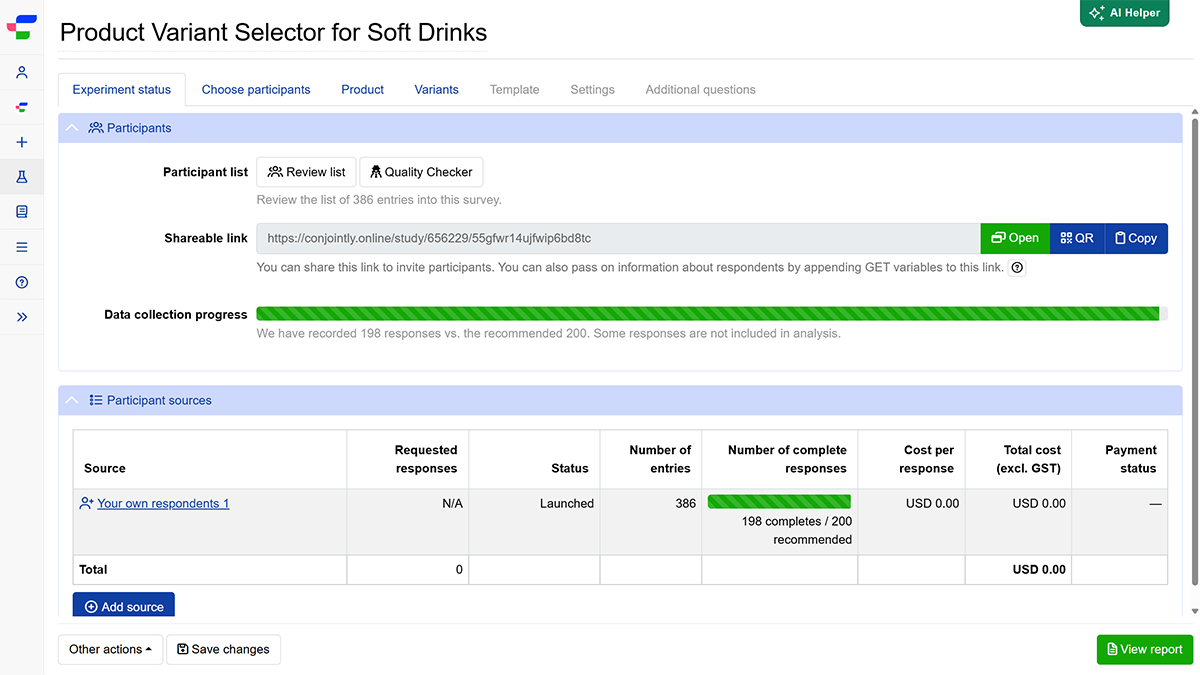
Once you launch your experiment, responses flow into your experiment dashboard in real time. You can use the Review participants and Quality checker tabs to review respondent behaviour, check data quality, and make adjustments as needed.
Step 3: Run your TURF analysis
With your data collected, Conjointly automatically processes and analyses your results. The Insights tab provides clear outputs to help you evaluate your variants, including a summary of preferences and diagnostics for each variant, a correlation analysis of relative preferences, a passport for each product variant, and more.

After reviewing your initial results, click on the TURF analysis tab to discover which combination of variants maximises your market reach and to see the optimal rollout order.
The TURF analysis simulator is preconfigured with industry-standard defaults. It delivers reliable results immediately without any extra setup.
For most projects, there is only one setting you need to adjust, which is the Number of items in combination. Simply set this value to your target range size. For example, enter 5 if you plan to launch five flavours, or 3 to evaluate a three-item lineup. You can easily run multiple market scenarios to compare how different portfolio sizes perform.
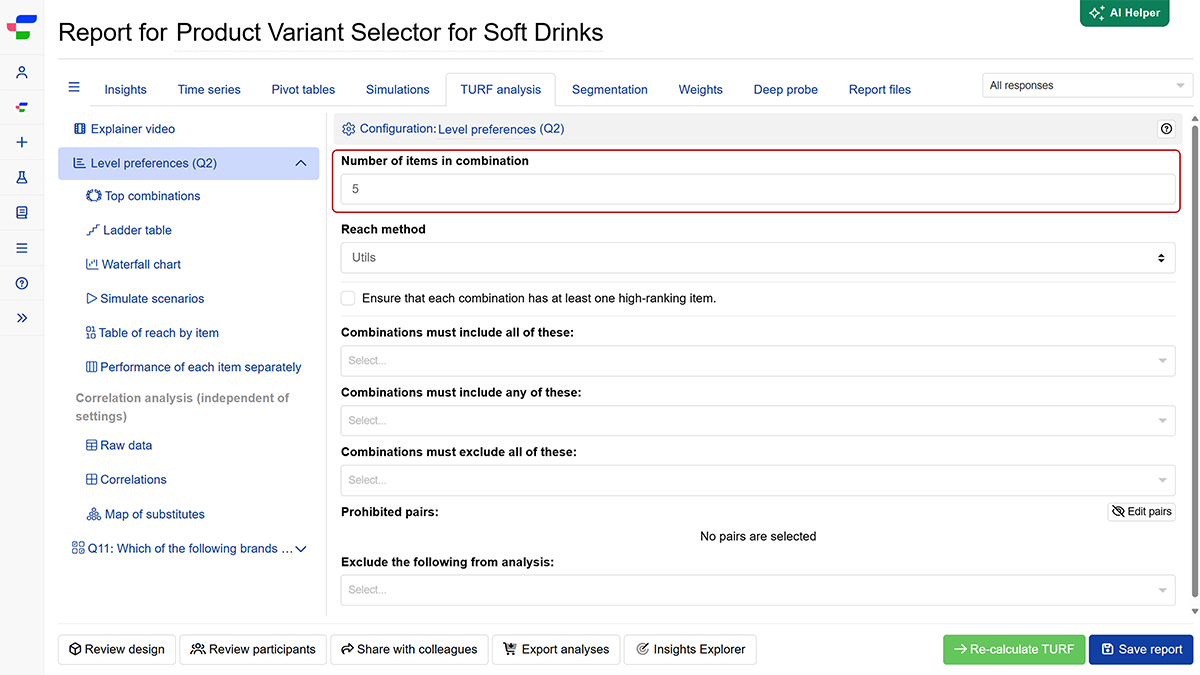
To explore or adjust advanced options, such as reach calculation methods or custom combination rules, check out our full TURF settings reference.
Key outputs for commercial decision-making
For incrementality and range optimisation, you can focus on the following outputs.
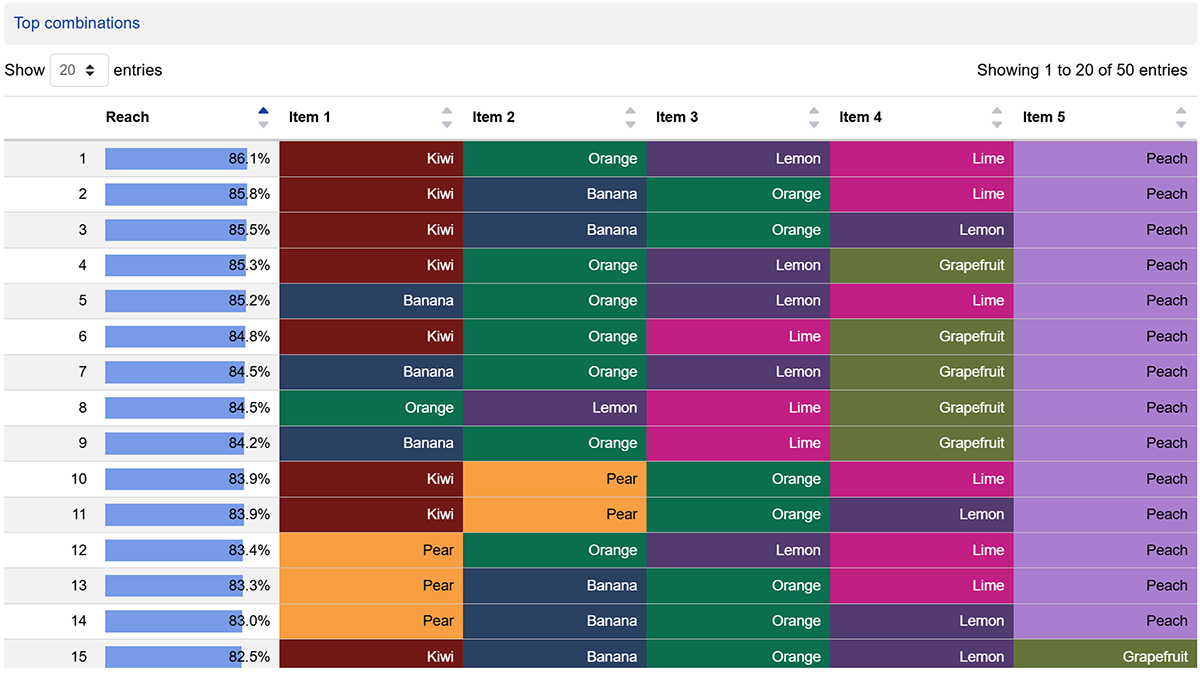
The top combinations table shows the best-performing line-up for however many items your range or budget allows. Change that item count and the ranking updates instantly, so you can see how the answer shifts as your constraints do.
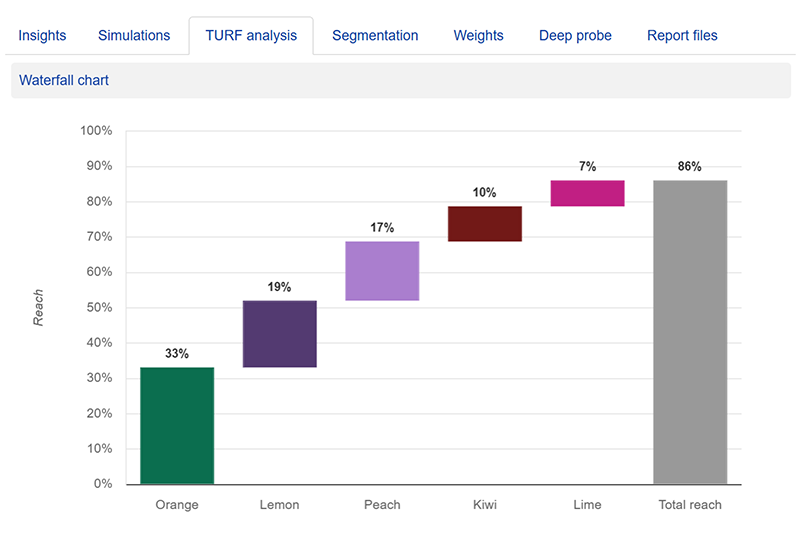
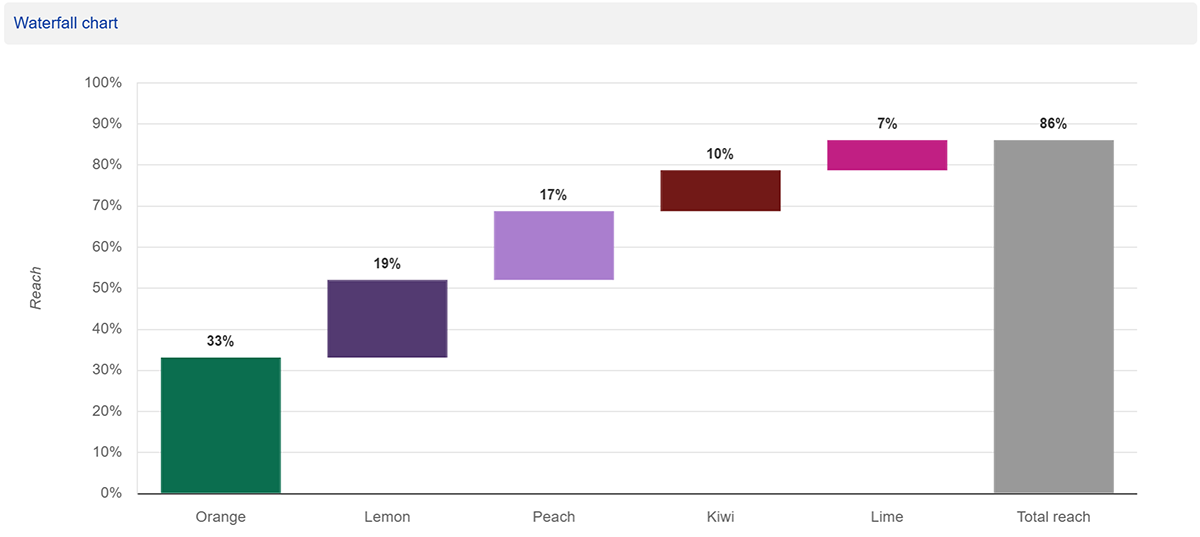
The prioritised launch sequence (the ladder) shows you the optimal staged release order. It tells you which anchor product to launch first, followed by the exact second product that brings in the highest number of new buyers, followed by the third, and so on.
The waterfall chart is another visual representation of the ladder. It shows the incremental gain of each added SKU, making it easy to spot the point of diminishing returns where adding another product no longer adds meaningful audience growth.
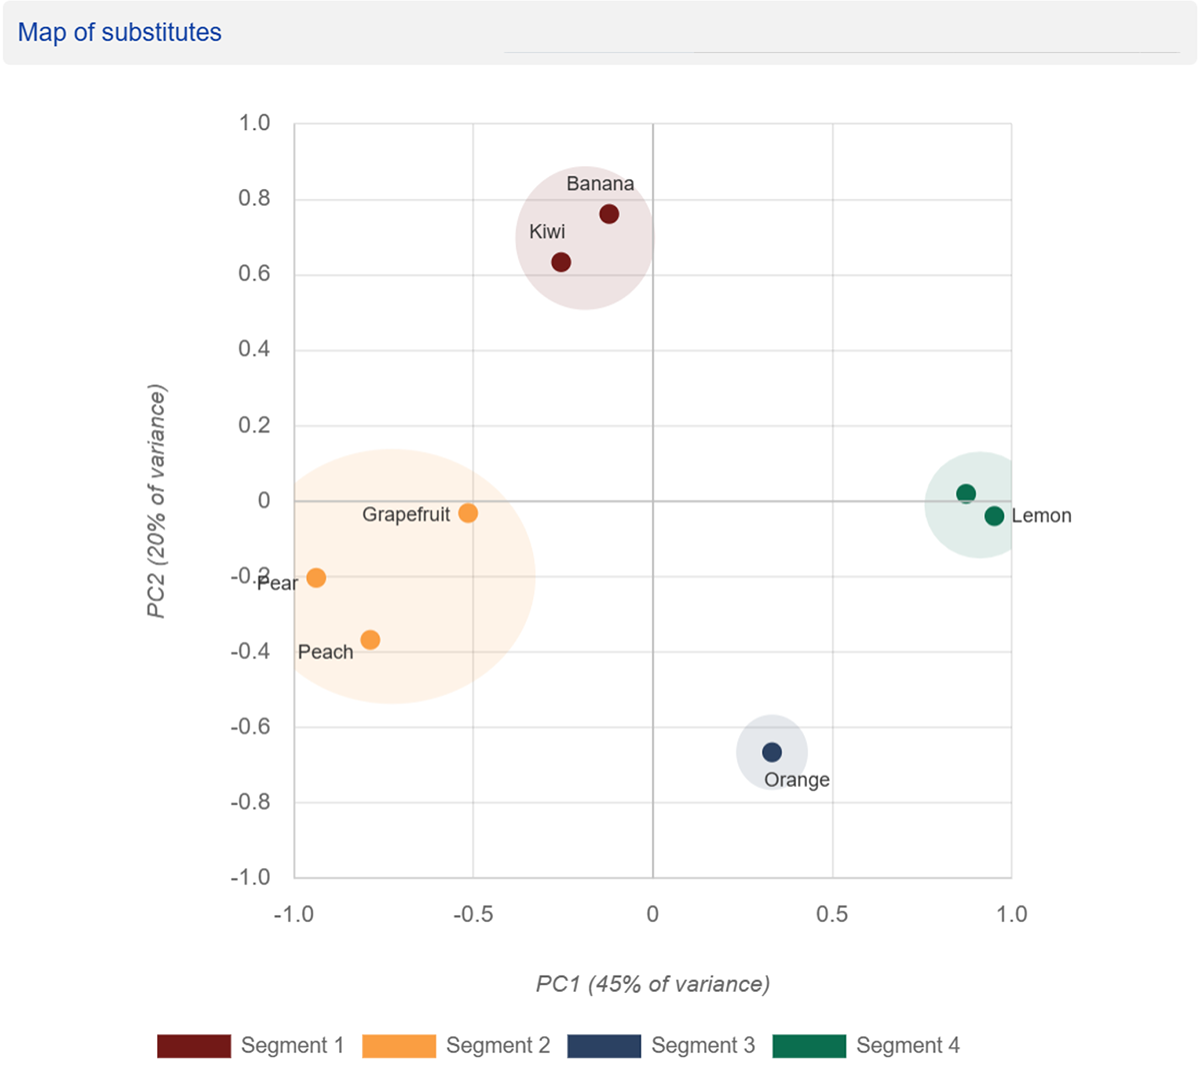
The map of substitutes visually groups products that appeal to similar buyers. By selecting items from separate clusters across the map, you can confidently build a lineup that reaches broad, diverse audience segments.
Getting the maximum value from your results
To make the most commercial impact with your TURF outputs, keep these practical guidelines in mind:
- Factor in competitor presence: Testing only your own product variants offers a great internal perspective, but adding key competitor benchmark products to your survey gives a truer picture of real-world incremental gains against rival brands.
- Remember portfolio context: TURF evaluates how individual items perform in combination based on customer preferences—it models individual customer choices across options rather than multi-buy bundle offers.
Ready to build your optimal product range?
Whether you are planning a seasonal refresh or overhauling your product line, running a TURF study gives you clear, data-backed evidence for every listing decision.
You can start immediately by setting up a Product Variant Selector study or exploring the interactive TURF Analysis Simulator. If you would like tailored advice on study design or audience sampling, book a quick consultation with our research team today.