
There are broadly two ways to measure the potential volume uplift to a category of products from introduction of NPDs:
- Preference share simulations: This is a simulation of the difference in preference share after the introduction of a new product against a base case scenario, which is the total preference share of the category without the NPD.
- By analysing paths of uplift: This approach relies on asking respondents additional questions about themselves, current product usage, and their predictions for how they will use the product.
Using preference share simulations
This approach works best if you use the setting “New product that customers are not used to buying” (i.e. second-stage “None of the above” option) in the conjoint analysis, where you end up with a large number of “None of the above” responses. This is because the “None of the above” option is an indicator of how many people are not currently using the product category, and therefore how many new users you can potentially attract to the category.
You can find out the uplift by simulating two scenarios:
Baseline- includes all current SKUs from both categories only.New preference share, including NPD- Include current SKUs and NPD.
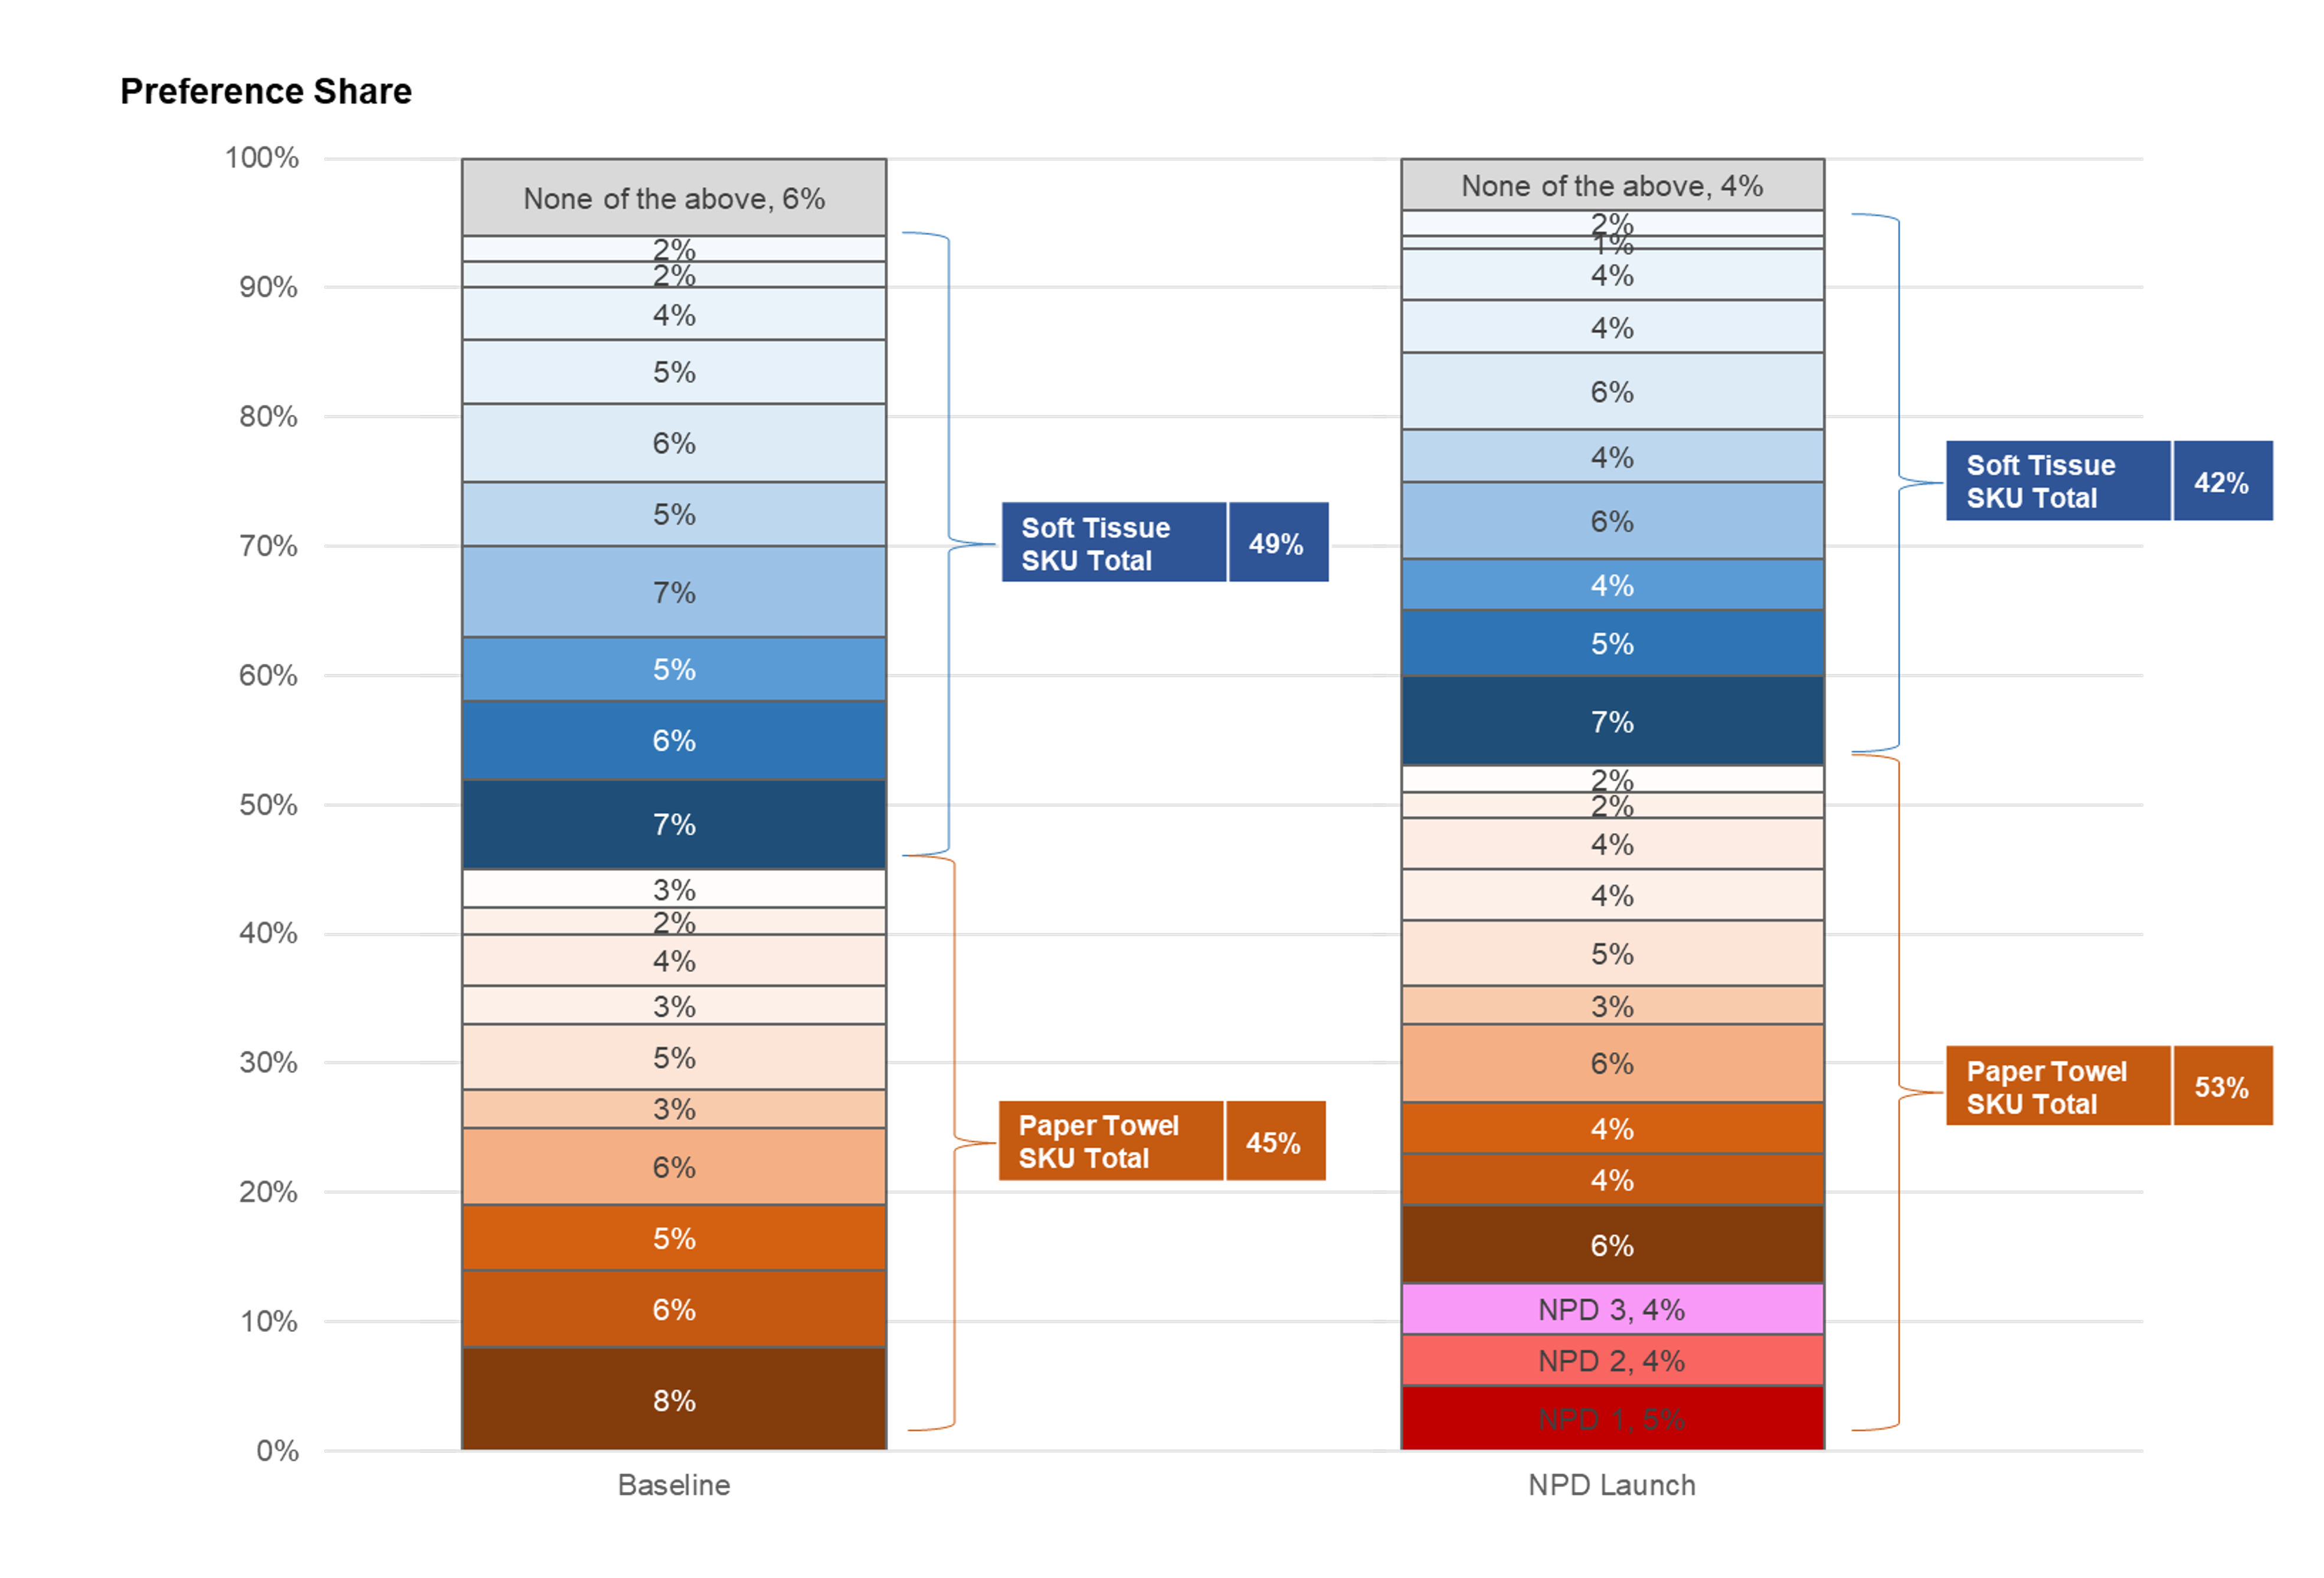
In the sample case study below, we simulated a study that is launching an SKU in paper towels that is likely to divert consumers from using softer tissues, we included:
- 10 current paper towel SKUs.
- 10 current SKUs from softer tissue SKUs.
- 3 paper towel NPDs.
- None of the above includes respondents who selected “Others”.
Preference share
As we can see from the simulation, launching the Paper Towel NPD would increase the preference share of the Paper Towel category from 45% to 53%, the NPDs gained share from softer tissue products SKU and None of the above. In other words, launching the NPD means category growth in terms of volume for paper towels, but it is cannibalising other tissue products in this case.

Importantly, you need to remember that in conjoint (at least if you use share-of-preference, rather than first-choice), adding more NPDs will always decrease None of the above. Therefore, this analysis should be done with either:
- Availability adjustments in such a way that the total availability of your products in the two scenarios is the same, or
- By simulating several (e.g. 4) concepts per product in the baseline and replacing some of the extra concepts with the NPDs in the “NPD launch” scenario.
You should consider extra shelf availability, advertising that increases mind share, etc. before deciding which approach to use.
Revenue Index
Revenue for the Paper Towel category also increased from 1,447K to 1,704K, most of which is cannibalised from the Soft Tissue category.

Source of Business
You can also determine the potential cannibalisation of a product or category of product by using the Source of Business function. In this example, we can see that the NPD mainly cannibalised shares from other paper towel SKUs and softer tissue SKUs, some shares are also gained from respondents who selected None of the above in the baseline case.

By analysing paths of uplift
Step 1: Build a framework
In general, category incrementality can be achieved in two ways:
- Attracting new users to the category:
- Converting non-users: The new product might address barriers that previously prevented certain consumers from entering the category, such as complexity, price, or perceived lack of need.
- Penetrating new consumer segments: The NPD can be designed to appeal to a demographic or psychographic group that currently does not use the product category.
- Increasing usage among existing users:
- Uplifting usage of light users: An NPD can make the product more appealing, convenient, or versatile for infrequent users, encouraging them to consume more or use it more regularly.
- Increasing frequency of purchase: The innovation might provide reasons for existing users to buy the product more often.
- Increasing volume of purchase: This involves encouraging consumers to buy more of the product per transaction.
- Penetrating new usage occasions:
- An NPD can adapt a product for new contexts (e.g. a new occasion, time of day, or location) that were previously not considered for the product category.
- Creating new needs or solutions: The product might solve a previously unrecognised or poorly addressed need, thereby creating a new reason to use the category.
This framework should be tailored to the specific category you are investigating. It’s worth investing time in building this framework for your project before you begin drafting the questionnaire. It is also helpful to have hypotheses such as:
- Adding NPD 1 (in addition to all existing products) will help us reach new users in demographic group X.
- Replacing current SKU 2 with NPD 3 will help us increase the frequency of purchase among existing users.
- etc.
Step 2: Design the questionnaire
Keeping this framework in mind, we can design questions to measure the potential uplift to a category of products, such as:
- Questions about the user, which can be varied (e.g. demographics, income, lifestyle, etc.).
- Questions about the current product usage:
- Do you use this category of products?
- What is your current product? (If respondents use multiple products, ask them separately to pick their primary product, so that you can base analysis on it.)
- How often do you buy [your current product]?
- How often do you use [your current product]?
- When you buy [your current product], how much (how many packs) do you buy on each shopping occasion?
- On what occasions do you currently use [your current product]?
- What do you use [your current product] for?
- Questions about both current and new products placed inside a monadic block (where respondents evaluate 3 or 4 products sequentially, among which there are NPD, current products, including those currently used by the respondent):
- On a scale of 1 to 5, how likely are you to buy [this product]?
- (Ask for current users only) Do you expect to buy [this product]…
- … instead of your current product.
- … in addition to your current product.
- This is my current product already.
- I would not buy it at all.
- I am not sure.
- How often would you buy [this product]?
- How often would you use [this product]?
- If you were to buy [this product], how much of it (how many packs) would you buy on each shopping occasion?
- For what occasions would you use [this product]? Please select all that apply.
- I would buy it for use at home.
- I would buy it for use at work.
- I would buy it for use on the go, on public transport.
- I would buy it for use in the car.
- I would buy it for use in the gym.
- [etc.]
- Other (please specify)
- ❌ None of the above
- What would you use [this product] for? Please select all that apply.
- I would use it for cleaning.
- I would use it for preparing food.
- I would use it for handcrafts.
- [etc.]
- Other (please specify)
- ❌ None of the above
The specific questions need to be adjusted to the product category you are investigating.
If the monadic block (question set #3 above) follows a conjoint as a diagnostic block, it may be tempting ask the questions only for the NPDs or the products that each individual respondent selected in the conjoint (either at the end of the conjoint or after each choice set). That would be a mistake which would disable the analyses that you need to perform after data collection.
For the analyses to run smoothly, it is worth making sure that each respondent sees at least one of:
- Their current primary product,
- At least one existing SKU that they do not use, and
- At least one NPD.
It can be achieved by splitting concepts across three different monadic blocks with identical questions inside of them. The three monadic blocks can be placed inside a randomisation block.
Step 3: Analyse different paths of uplift
(1.1) Converting non-users
An indication that an NPD will convert non-users to users is if among category non-users (question 2.1), the NPD is rated as more likely to be bought (question 3.1) than any current SKU.
As with the rest of analyses discussed here, this indication should be thought of more as a necessary precondition rather than a guarantee that the projected uplift path will eventuate. That is because we rely on stated preferences and intentions, especially if we do this research for the first time in a category without the benefit of comparing past behaviour data against stated intentions recorded from past research projects in the same category.
(1.2) Penetrating new consumer segments
- Identify several segments among your respondents and allocate respondents into them. You can use clustering or rules-based segmentation.
- For each segment, calculate the Top-2-Box likelihood to buy (question 3.1)
- your NPDs,
- existing products that are not their current product (question 2.1).
- their current product (question 2.1).
- For each segment, calculate the differences in Top-2-Box scores:
- of the NPDs and respondents’ current product (
α), - of the existing products that are not their current product and respondents’ current product (
β).
- of the NPDs and respondents’ current product (
- An indication that the NPD will help penetrate new consumer segments is if there exists such a segment for whom
αis greater thanβandαis positive.
Why do we need to check for whether α is greater than β? “Grass is often greener on the other side”, hence some respondents may claim higher likelihood to buy a product that they do not currently use than a product they do use in fact. But because we know they are overclaiming their likelihood to buy, we need to set that level of overclaiming as a threshold for analysis of NPDs.
You can run similar analysis not only on purchase intent, but also on:
- frequency of purchase (question 3.3),
- frequency of use (question 3.4),
- amount of purchase (question 3.5),
- occasions of use (question 3.6),
- reasons for use (question 3.7).
(2.1) Uplifting usage of light users
- Identify light users of the category (question 2.3).
- Calculate the frequency of purchase (question 3.3) and frequency of use (question 3.4) for:
- your NPDs,
- existing products that are not their current product (question 2.1).
- their current product (question 2.1).
- Calculate the differences in anticipated frequency of purchase and frequency of use:
- of the NPDs and respondents’ current product (
α), - of the existing products that are not their current product and respondents’ current product (
β).
- of the NPDs and respondents’ current product (
- An indication that the NPD will help uplift usage of light users is if (for either frequency of purchase or frequency of use):
αis greater thanβandαis positive.
(2.2) Increasing frequency of purchase
- Among all respondents, calculate the frequency of purchase (question 3.3) and frequency of use (question 3.4) for:
- your NPDs,
- existing products that are not their current product (question 2.1).
- their current product (question 2.1).
- Calculate the differences in anticipated frequency of purchase and frequency of use:
- of the NPDs and respondents’ current product (
α), - of the existing products that are not their current product and respondents’ current product (
β).
- of the NPDs and respondents’ current product (
- An indication that the NPD will help increase frequency of purchase is if (for either frequency of purchase or frequency of use):
αis greater thanβandαis positive.
(2.3) Increasing volume of purchase
Two different analyses can be done here:
- Repeat the analysis of frequency of purchase and frequency of use, but for amount of purchase (question 3.5).
- A different analysis based in question 3.2:
- Among all respondents, calculate the percentage of people who claim in question 3.2 that they will use the product in addition to their current product for:
- your NPDs,
- existing products that are not their current product (question 2.1).
- Calculate the difference between
- that percentage for NPDs and
- the highest percentage among existing products that are not their current product.
- An indication that an NPD will help increase category volume is if the difference calculated in the previous step is positive.
- Among all respondents, calculate the percentage of people who claim in question 3.2 that they will use the product in addition to their current product for:
(2.4) Penetrating new usage occasions and reasons for use
Repeat the analysis of frequency of purchase (2.2), but instead of frequency, run analysis separately for percentage of respondents who choose each option in questions 3.6 and 3.7.
Running all these various analyses will help you understand if the NPDs are likely to increase the category volume and if so, how.