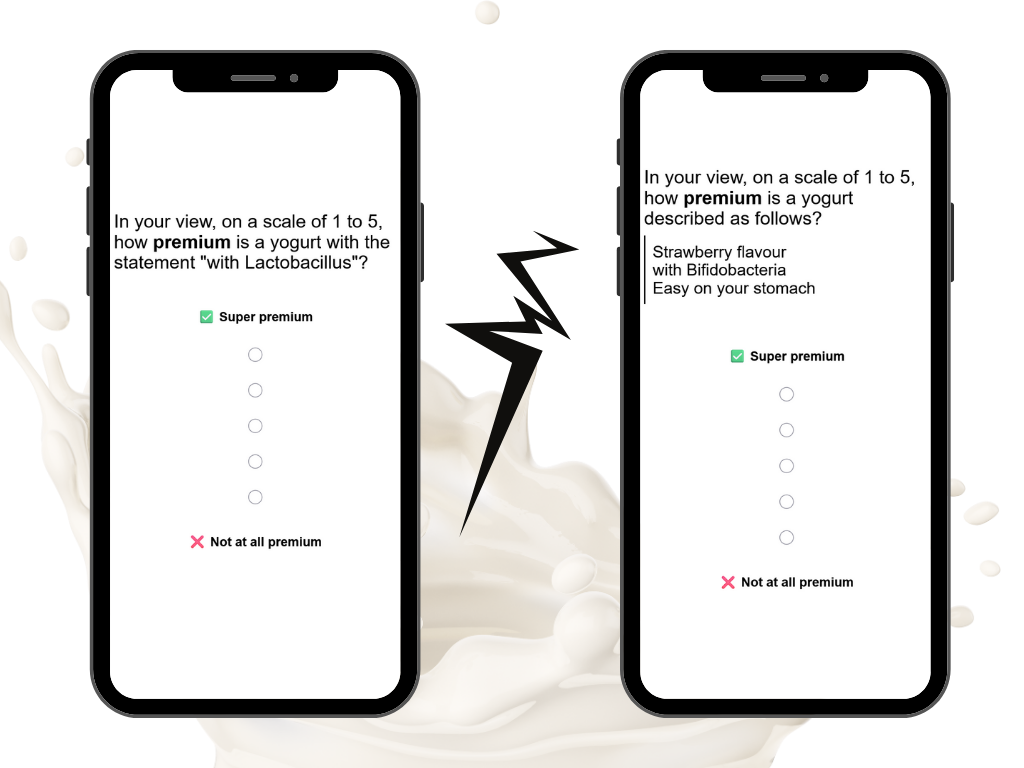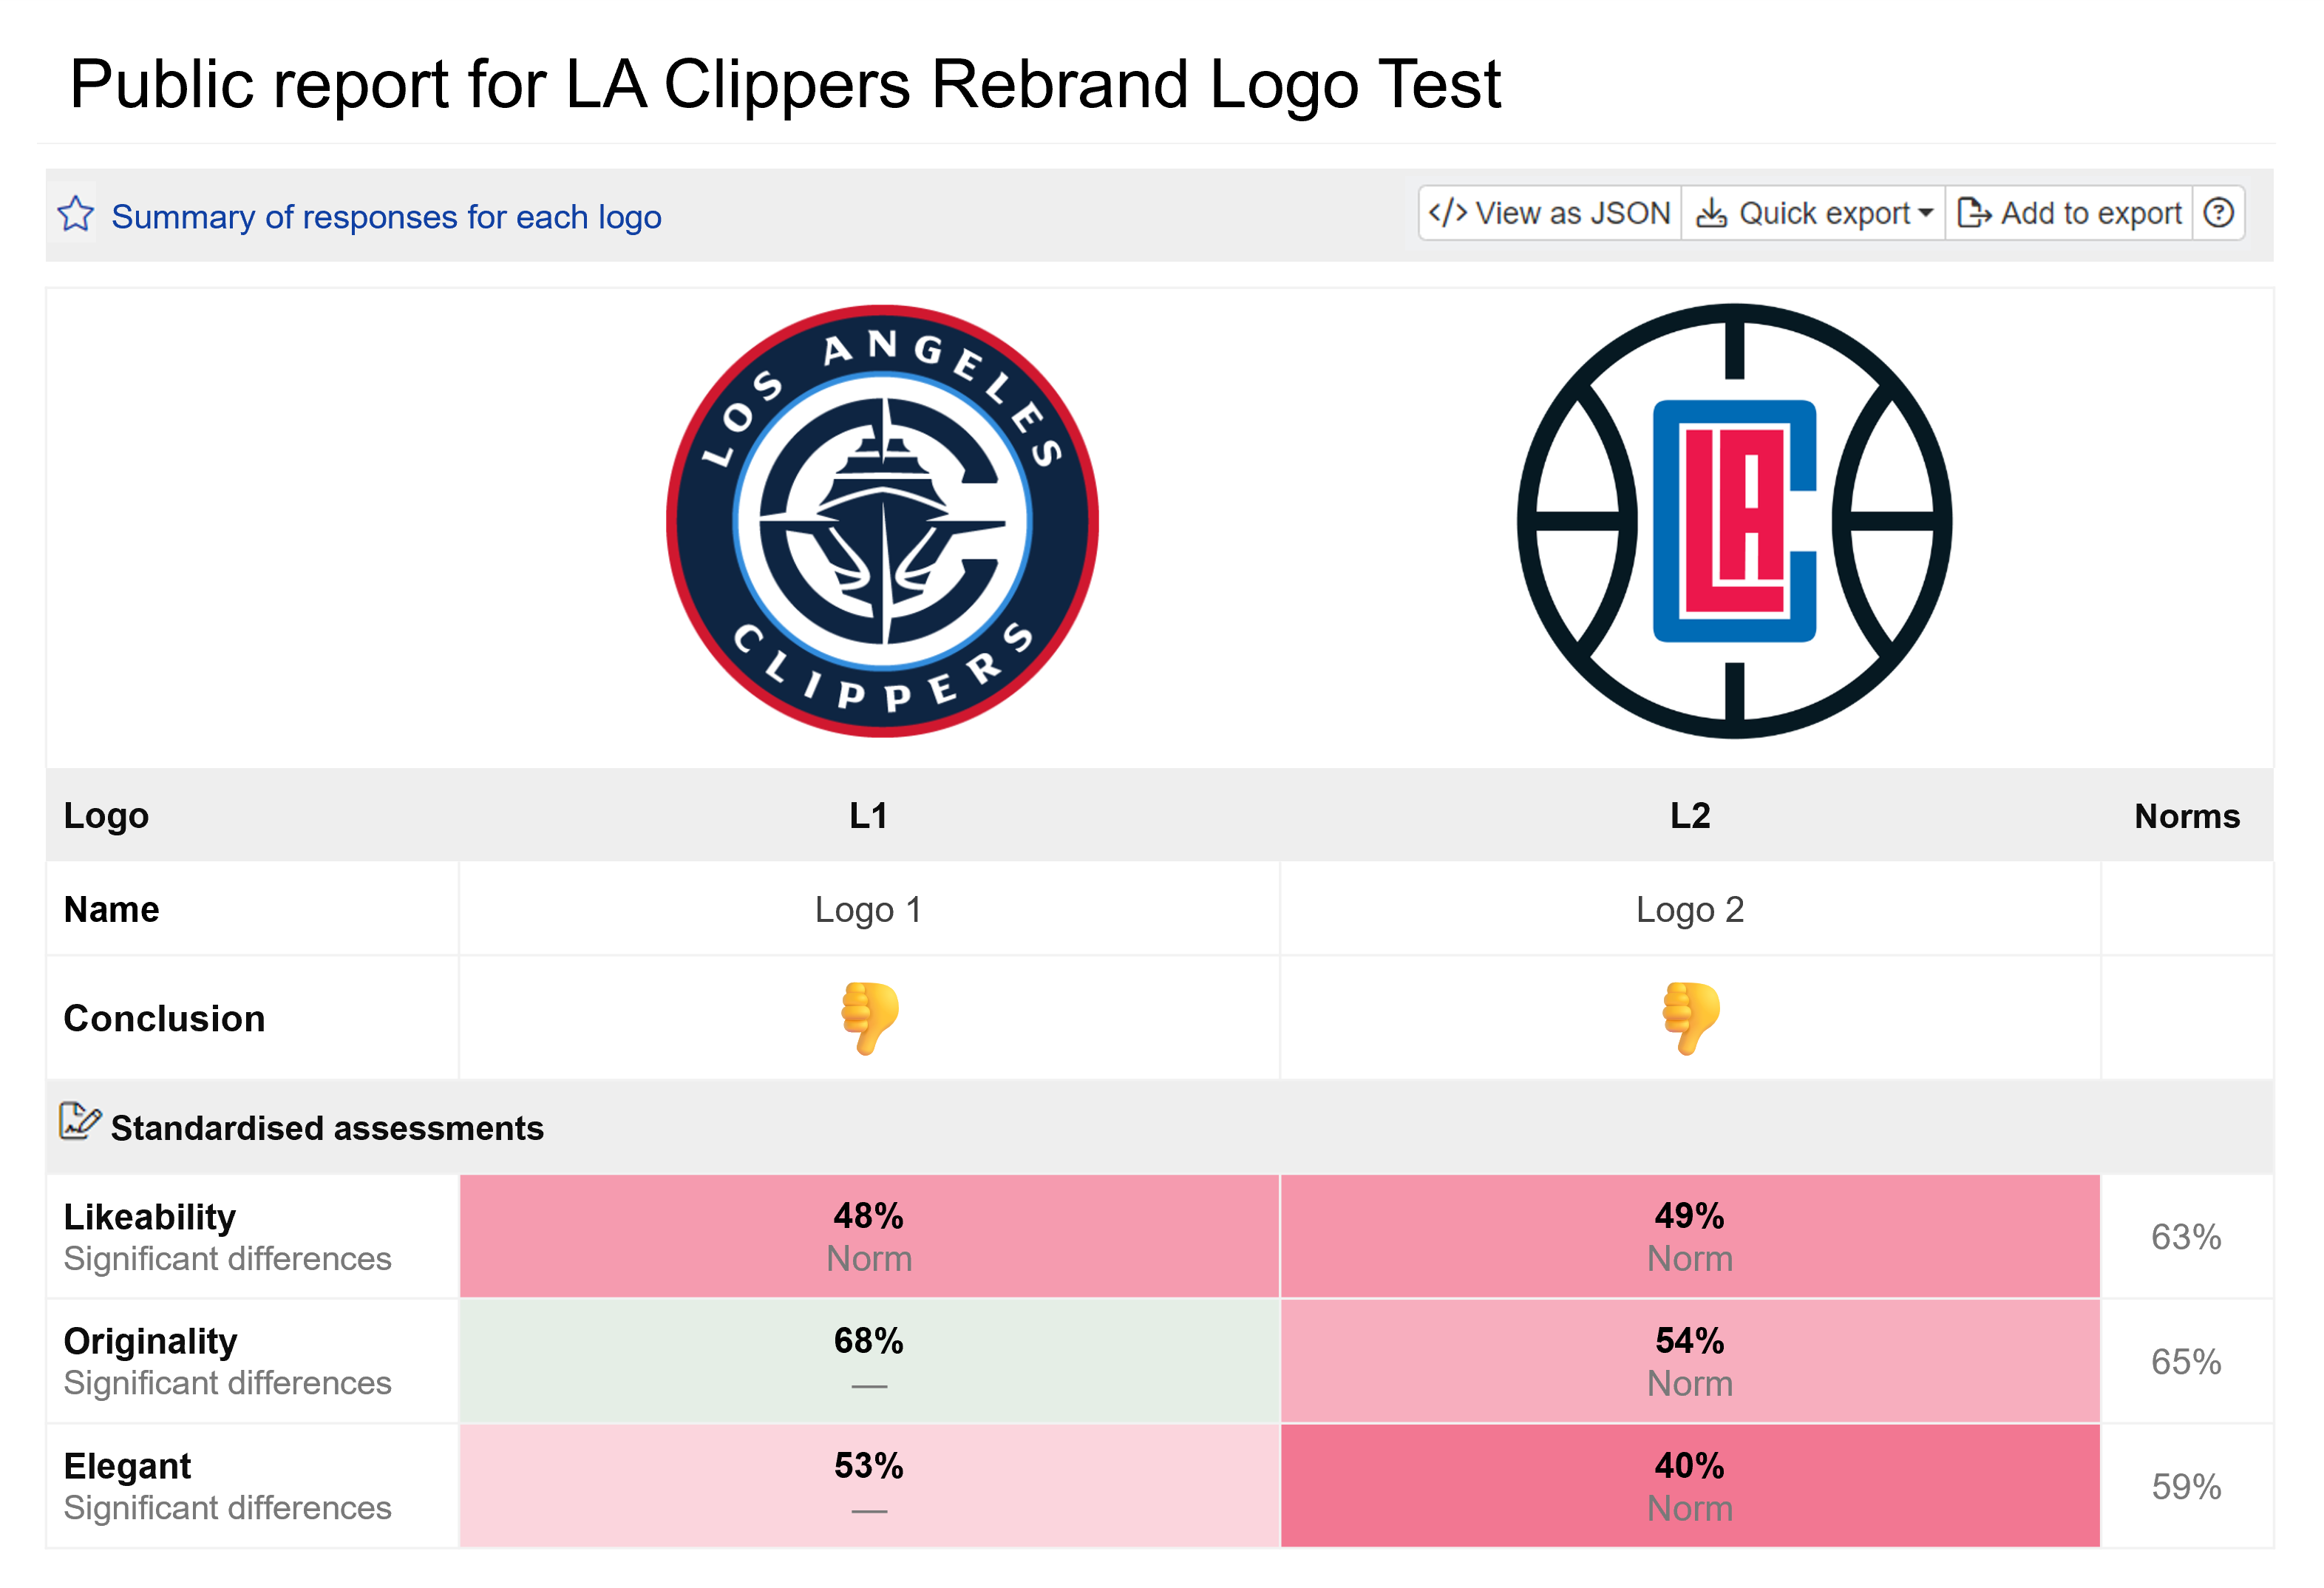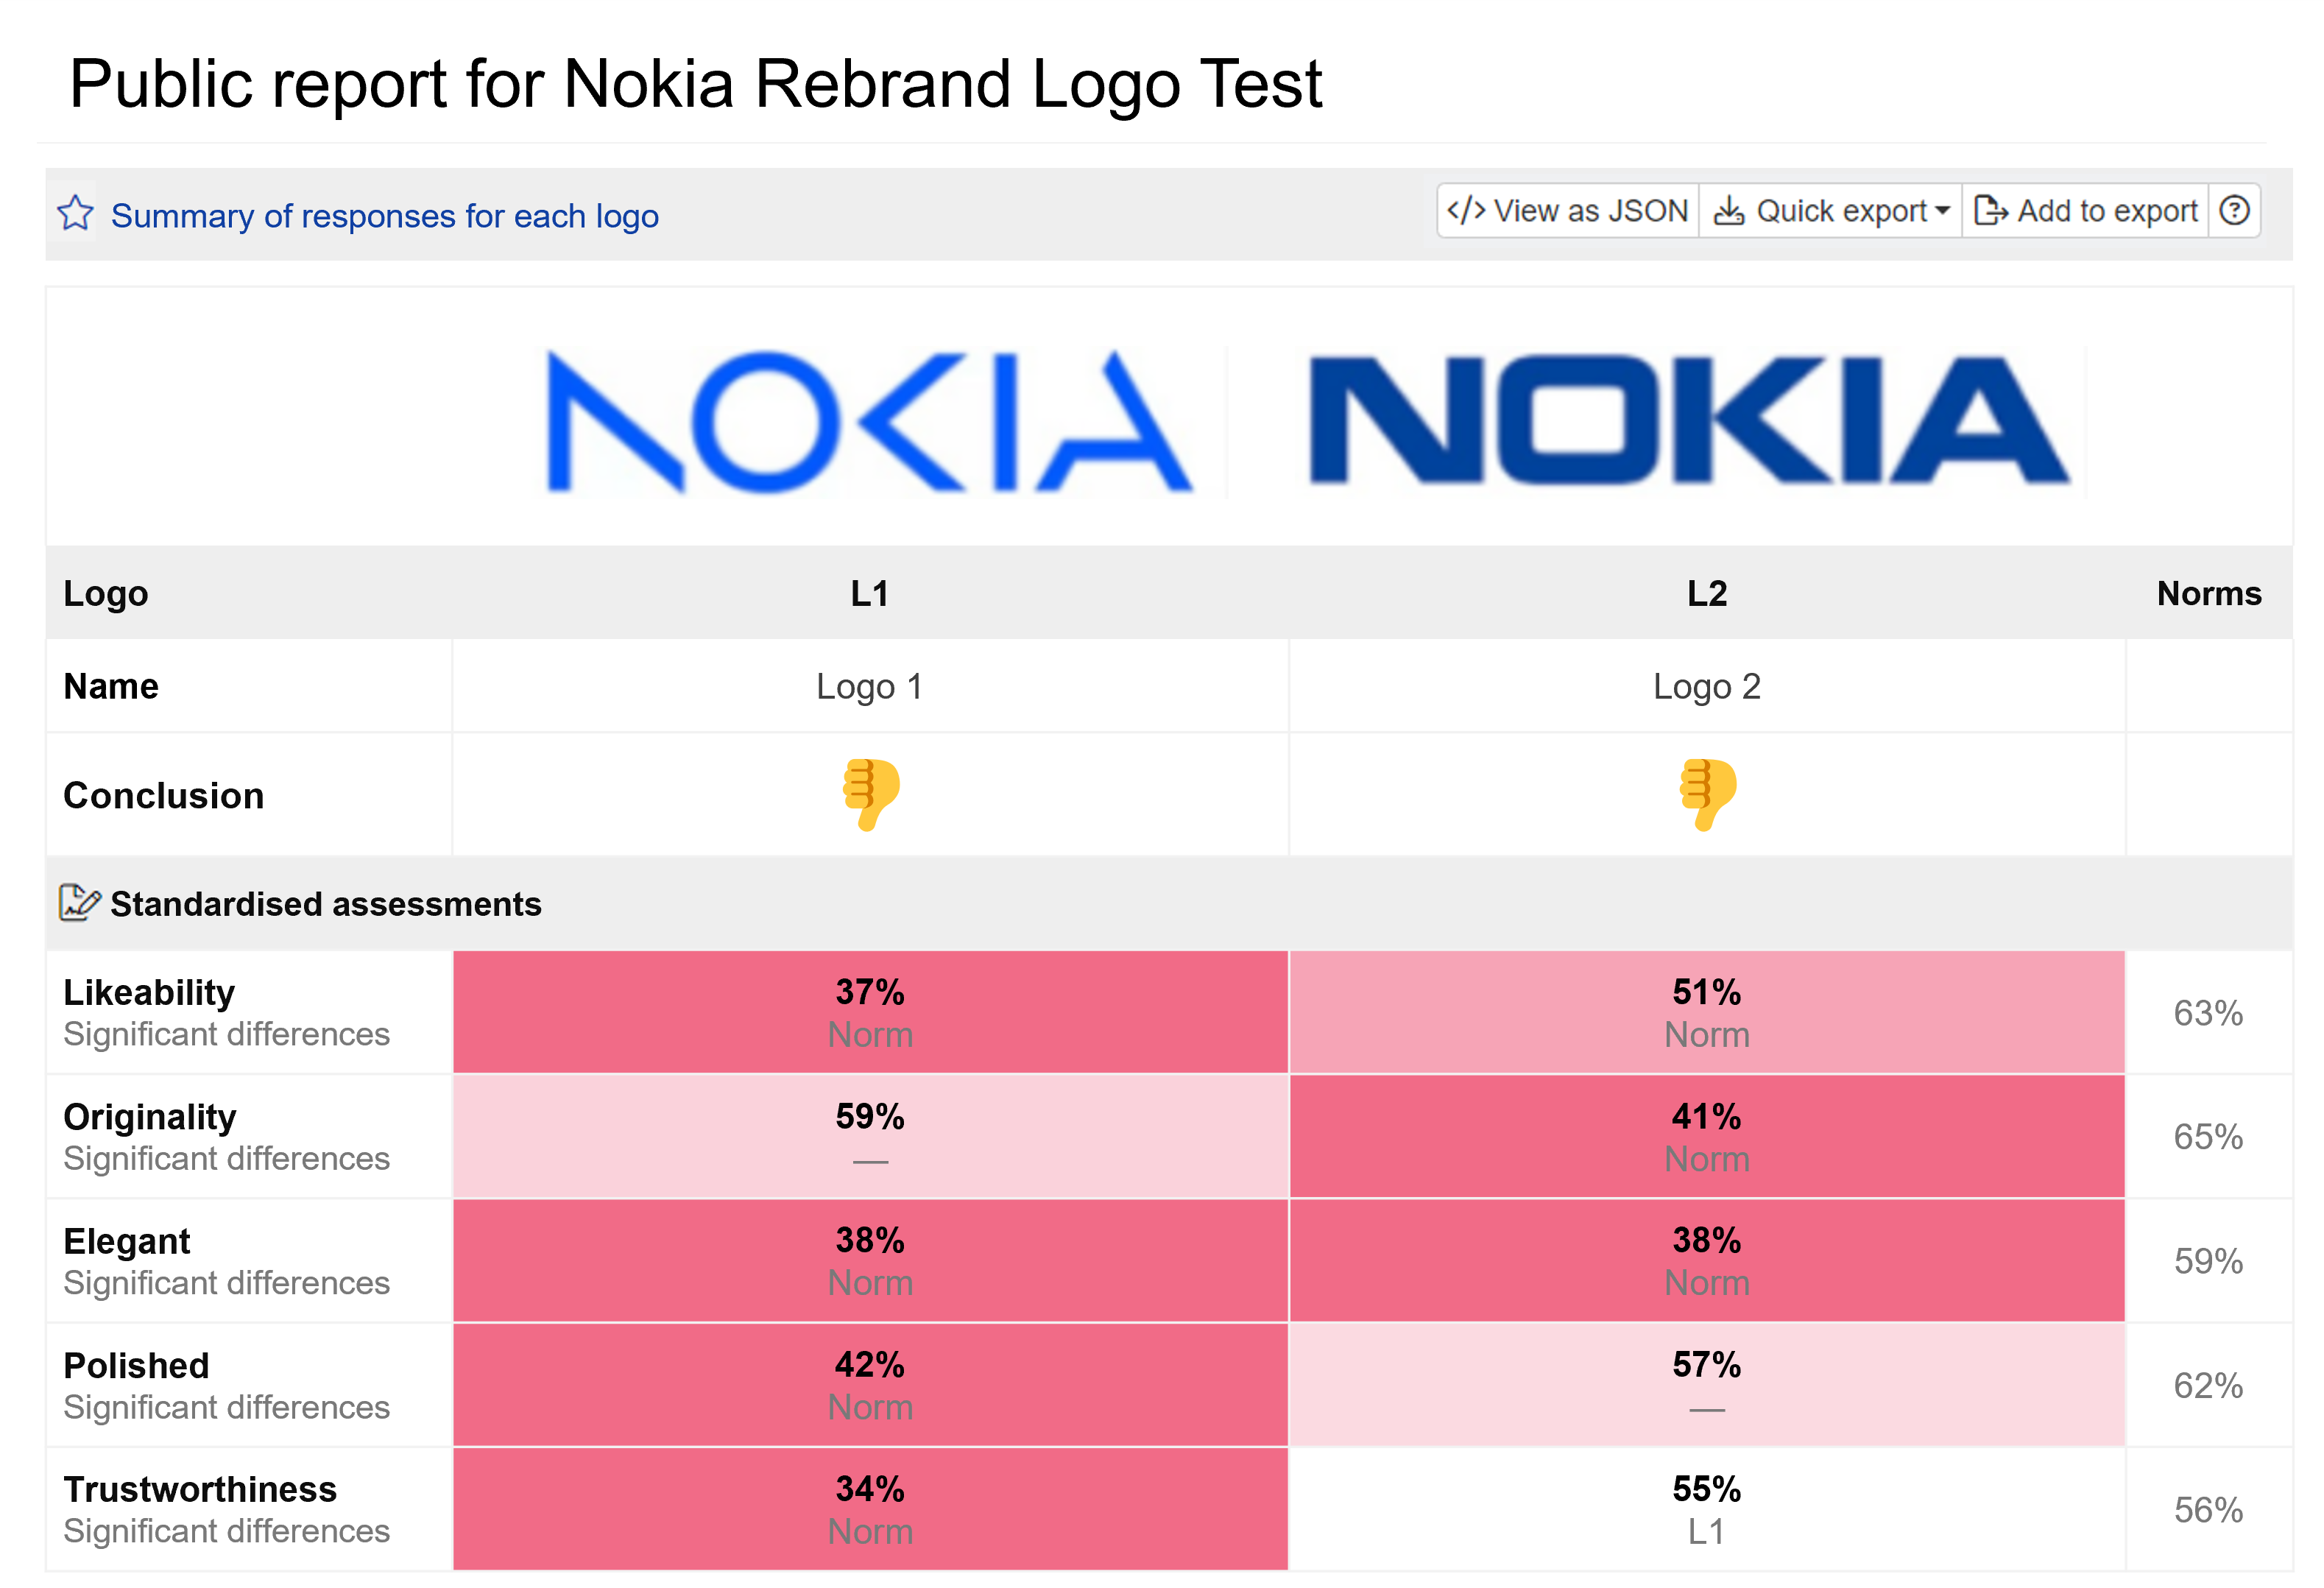

On Conjointly it's easy to make typing tools that use calculated variables to compare different groups. Here's an example.
Typing tools are commonly used in market research. They allow you to classify respondents into different groups based on their answers to a series of questions and branch them to different parts of the survey or show them different content. Their responses can be analysed separately or compared to each other.
In this post, we do not address how to make typing tools from scratch (i.e., how to identify your segments, find best questions to discriminate between them, and find the coefficients for each question and segment). Instead, we focus on how to implement an already created typing tool once you have an Excel deliverable from a market research agency or a consultant.
Overview of an example typing tool
Say you want to classify people by their level of environmental concern. Most commonly, you will receive an Excel file with a structure similar to the following example:
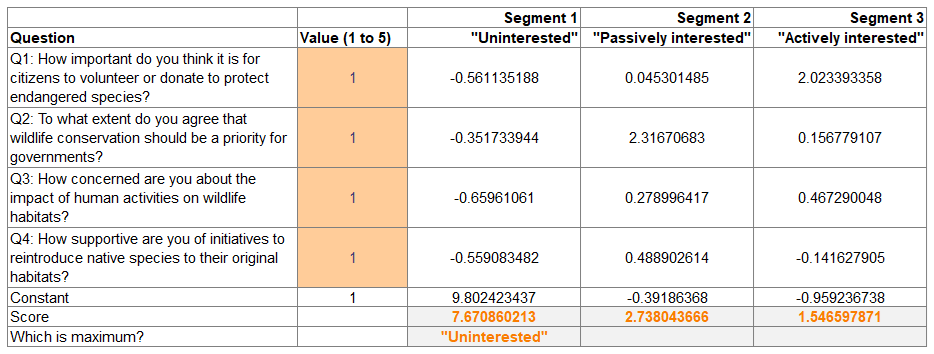
In this example, rows represent questions, columns represent segments, and cells contain coefficients. The last row contains the constant for each segment.
An interactive Excel sheet will let you input the answers to the questions and calculate the score for each segment. The segment with the highest total score is the one that the respondent belongs to. For example:
| Question | Likert scale answer (1 to 5) | Segment 1: "Uninterested" | Segment 2: "Passively interested" | Segment 3: "Actively interested" |
|---|---|---|---|---|
| Q1: How important do you think it is for citizens to volunteer or donate to protect endangered species? Enter 1-5 | -0.561135188 × - | 0.045301485 × - | 2.023393358 × - | |
| Q2: To what extent do you agree that wildlife conservation should be a priority for governments? Enter 1-5 | -0.351733944 × - | 2.31670683 × - | 0.156779107 × - | |
| Q3: How concerned are you about the impact of human activities on wildlife habitats? Enter 1-5 | -0.65961061 × - | 0.278996417 × - | 0.467290048 × - | |
| Q4: How supportive are you of initiatives to reintroduce native species to their original habitats? Enter 1-5 | -0.559083482 × - | 0.488902614 × - | -0.141627905 × - | |
| Constant | 1 | 9.802423437 | -0.39186368 | -0.959236738 |
| Total segment score | - | - | - | |
Setting up a typing tool on Conjointly
To set up a typing tool on Conjointly, you need to:
- Insert the questions used for classification into your survey.
- Set up one calculated variable for each segment.
- Set up one more calculated variable to determine the segment with the highest score.
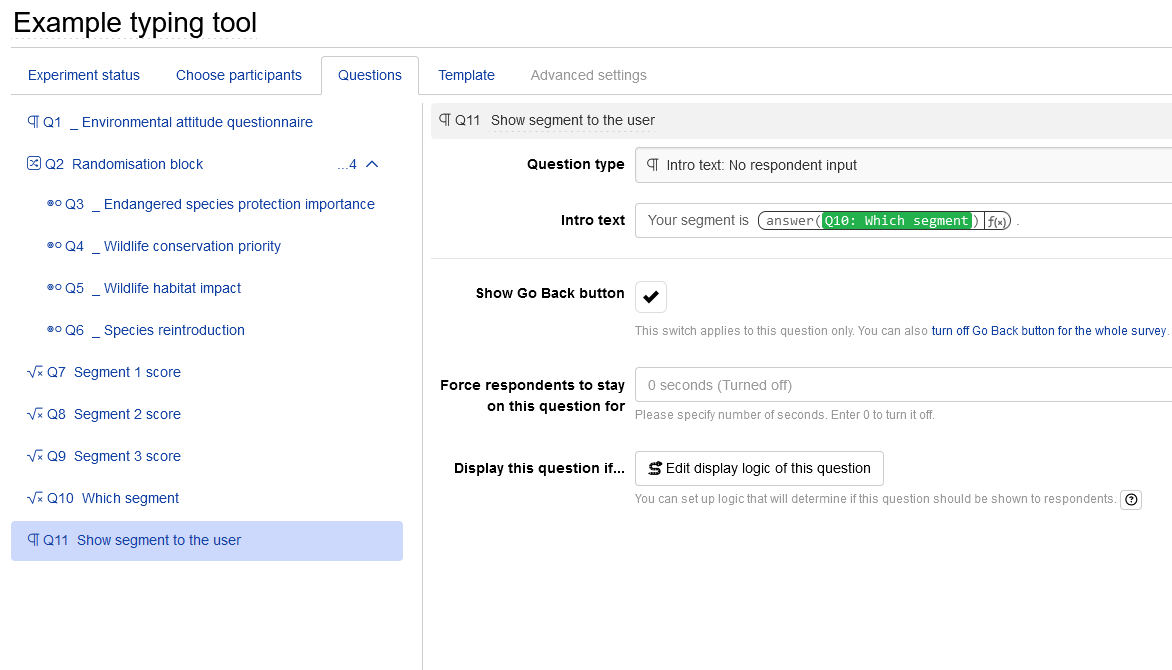
In the calculated variables for each segment, the formula will be the sum of the products of the coefficients and the answers to the questions. For example, for segment 1 we pull answers from Likert scale questions and multiply them by the coefficients:
answer(5165960) * -0.561135188 +
  answer(5165961) * -0.351733944 +
  answer(5165962) * -0.65961061 +
  answer(5165963) * -0.559083482 +
  9.802423437
For segment 2:
answer(5165960) * 0.045301485 +
  answer(5165961) * 2.31670683 +
  answer(5165962) * 0.278996417 +
  answer(5165963) * 0.488902614 +
  -0.39186368
For segment 3:
answer(5165960) * 2.023393358 +
  answer(5165961) * 0.156779107 +
  answer(5165962) * 0.467290048 +
  answer(5165963) * -0.141627905 +
  -0.959236738
The last calculated variable will select the segment with the highest score using if-else statements. For example:
ifs(
  answer(5165964) == max(answer(5165964), answer(5165965), answer(5165966)),
  "Uninterested",
  answer(5165965) == max(answer(5165964), answer(5165965), answer(5165966)),
  "Passively interested",
  "Actively interested")
)
You can try the survey yourself.
Conclusion
You can use the result from the calculated variable to branch respondents to different parts of the survey or show them different content. You can also use the result for analysis, with calculated variable values being available in the experiment’s report for creating pivot tables, segments, and weightings, and are also included when exporting your experiment’s raw data.
If you need any assistance in the setup, please contact Conjointly support.