Discover the fundamentals of conjoint analysis, from key concepts to study design and results analysis, through this companion article to our popular Conjoint Analysis 101 webinar.
Generic Conjoint
Feature and claim selection and measuring willingness to pay for features for a single product.
Conjointly is the go-to expert in conjoint analysis. Our “Conjoint Analysis 101: with example for New Product Development” webinar has helped thousands of participants master the fundamentals of conjoint analysis. This companion article summarises the webinar’s key takeaways to help you get the most out of your conjoint analysis.
What is conjoint analysis?
Conjoint analysis is a survey-based quantitative research technique that presents respondents with various product or service options, each with different combinations of attributes and levels. By analysing their choices, conjoint analysis identifies consumer utilities (a.k.a “part-worth utilities” or “relative preferences”) for each attribute and level, helping you uncover consumer-preferred product or service configurations among all possible combinations.

Conjoint analysis is a powerful research method that helps businesses:
- Select product features for new or revamped products.
- Identify the marginal willingness to pay for specific features relative to other features.
- Determine optimal product pricing.
- Evaluate the adoption potential of new products or services.
- Test impact of packaging, product claims, and advertising messaging.
Conjoint analysis in 5 steps
Step 1: Identify attributes and levels
The first step in conjoint analysis is to identify the attributes and levels of your product or service that you want to test.
Attributes are the key dimensions of your product that influence customer purchasing decisions. For example, a yoghurt manufacturer might test attributes like ‘brand’, ‘probiotic content claims’, ‘pack type’, ‘volume’, ’eco labelling’, and ‘pricing’.
Levels are the ‘values’ that each attribute can take. For example, the ‘pack type’ attribute can have levels ‘glass bottle’, ‘plastic cup’, and ‘squeeze pouch’. Some attributes may be binary, with only two levels, such as ’eco labelling’ with levels ‘present’ or ‘absent’.
When specifying attributes and levels for your conjoint study, consider these recommendations from Conjointly’s experts to optimise your study design:
- Focus on the most important attributes to your customers.
- Limit the number of attributes to seven or fewer, and include price if possible.
- Ensure levels are precise, realistic, and mutually exclusive within each attribute.
- Use customer-friendly language and images to describe attributes and levels.
Please note that each attribute must have at least two levels to ensure respondents have choices to make. You can also check out these expert tips on attributes and levels for your conjoint study to get the most out of your conjoint analysis.
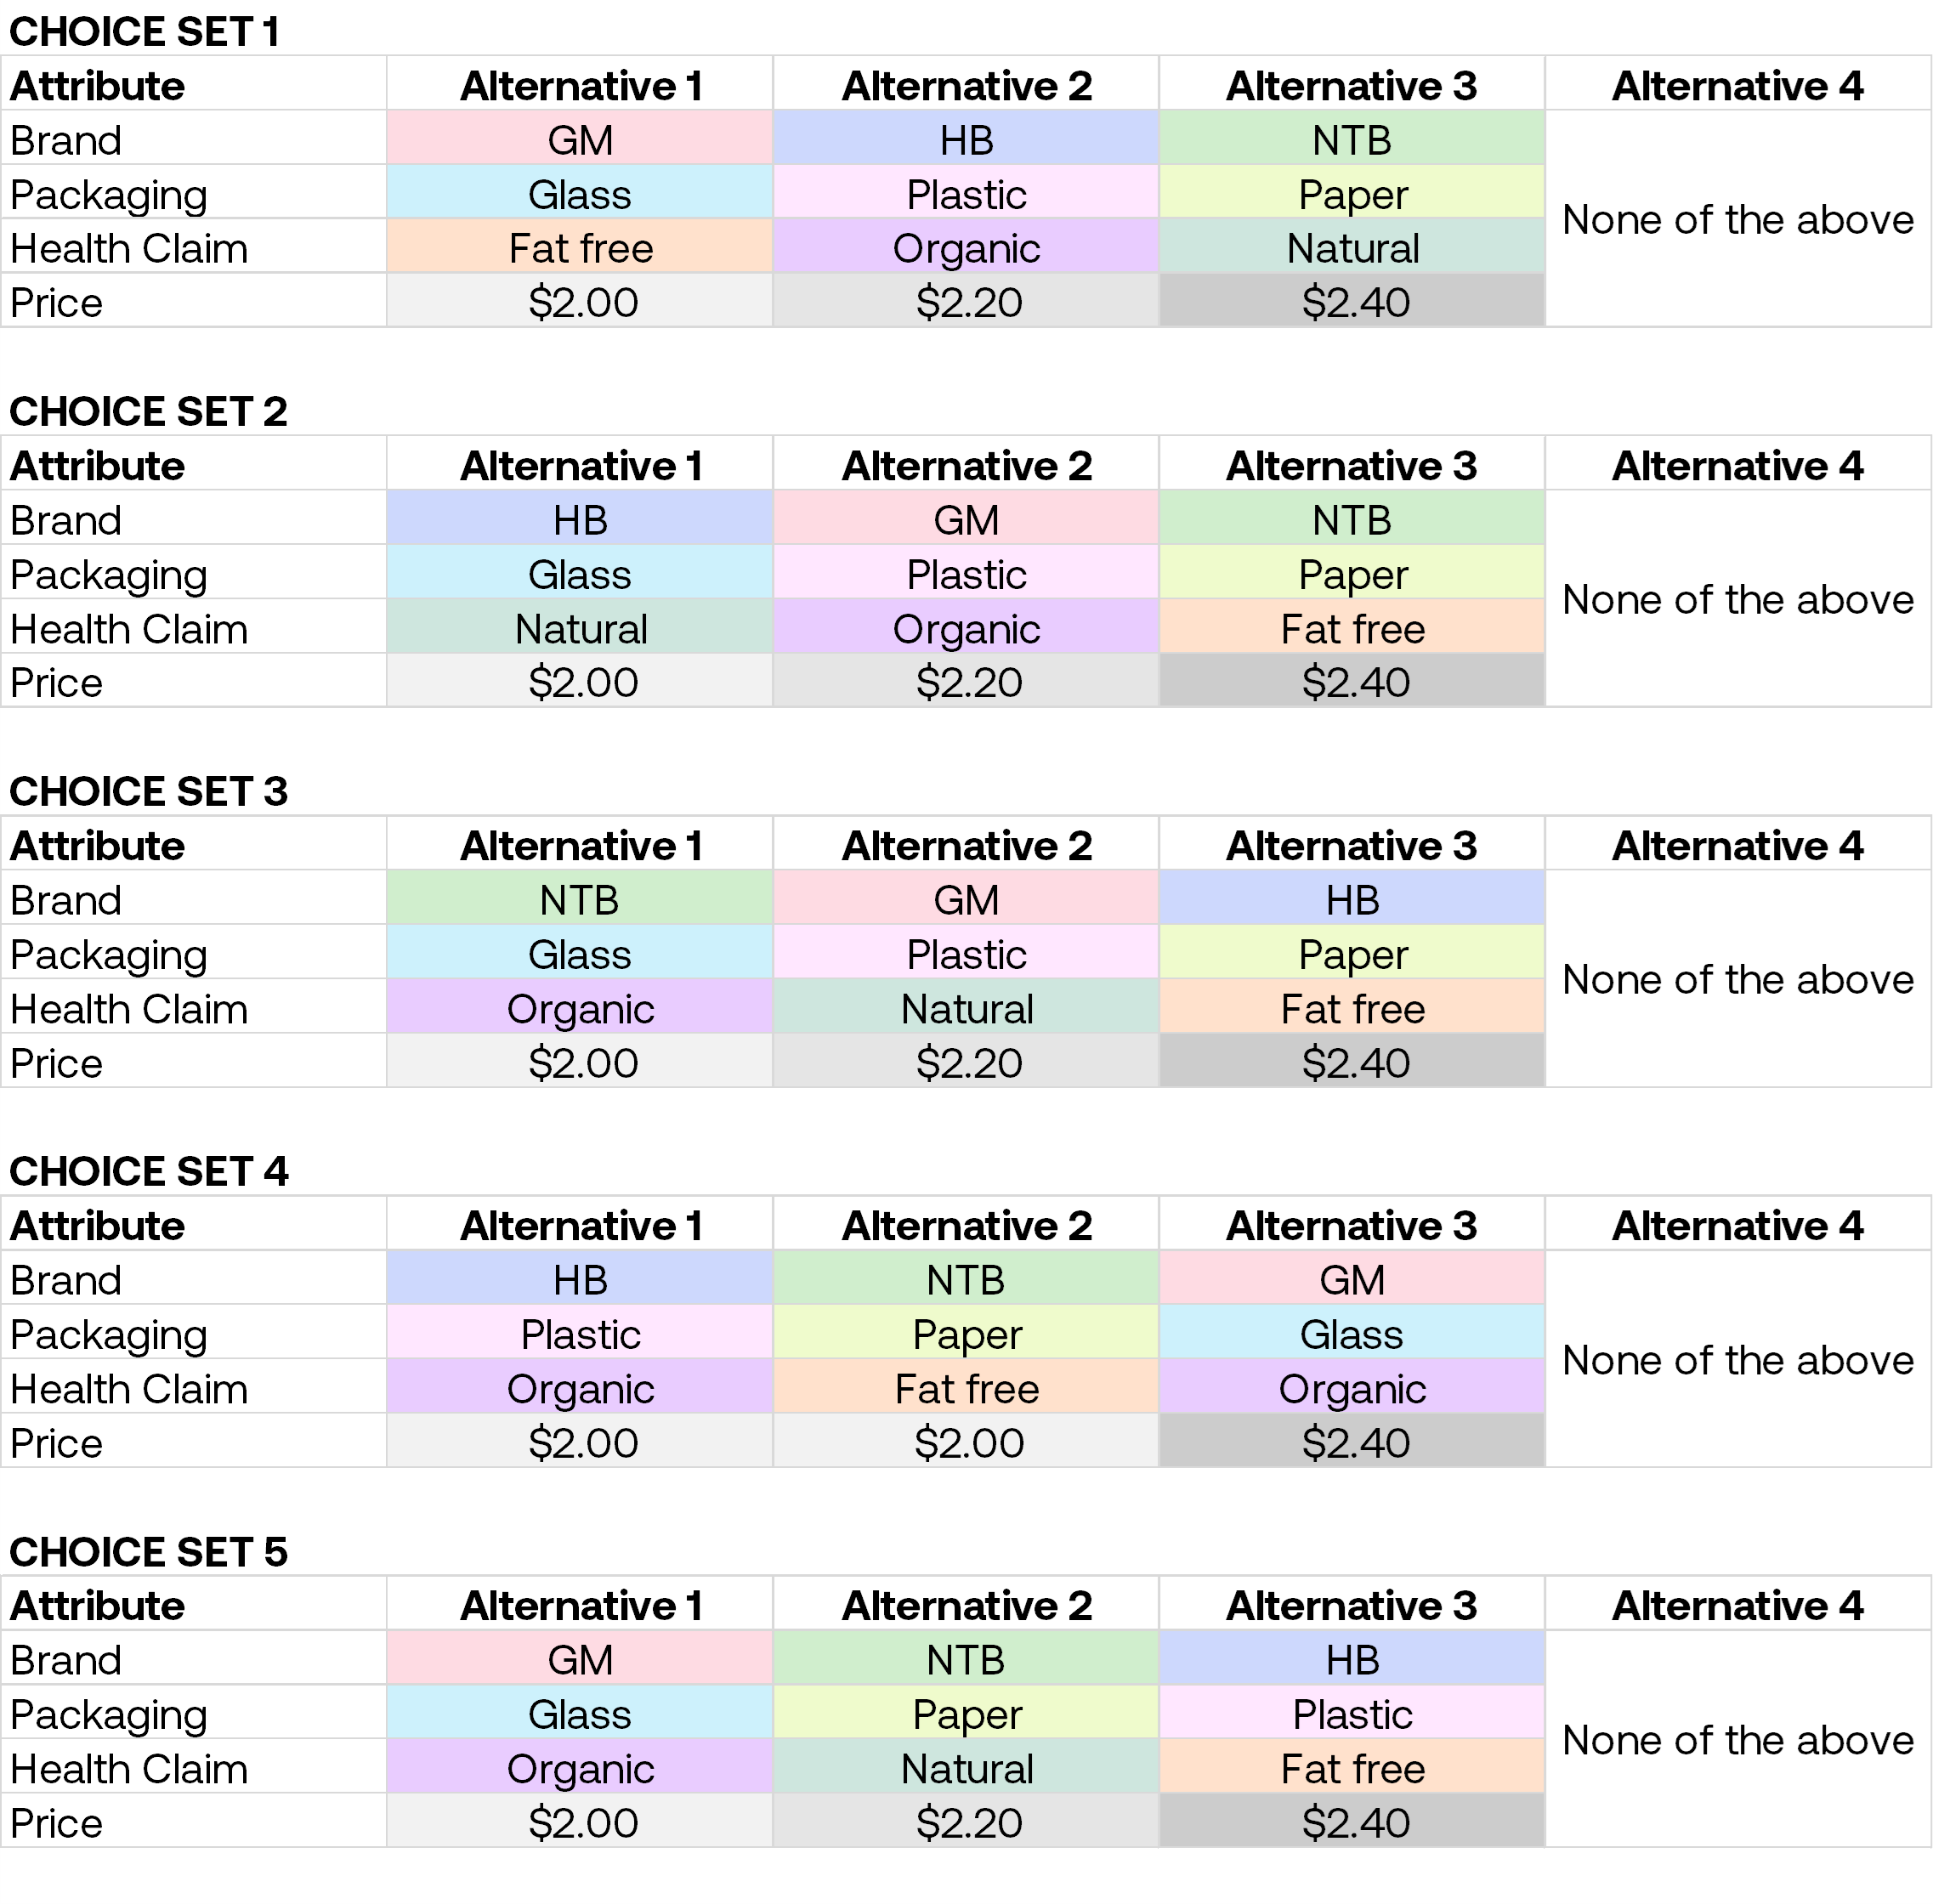
Step 2: Create choice tasks
After identifying the attributes and levels to test, the next step is to create an experimental design for the conjoint analysis. This involves combining the attributes and levels into product concepts/alternatives and grouping them into choice tasks/questions. Each respondent is typically presented with 8 to 12 choice tasks.
Experimental design requires extensive statistical and mathematical analysis. Conjointly streamlines this process, automatically handling the intricate calculations to create an optimal design for your study, so you can focus on gaining valuable insights.
Step 3: Set up your conjoint experiment
With your attributes, levels, and experimental design ready, it’s time to set up your conjoint experiment. Conjointly’s user-friendly setup wizard, combined with pre-filled templates and customisable options, allows you to create and launch your experiment in minutes.

With Brand-Specific Conjoint, you can quickly and easily specify which attribute levels apply to specific brands, tailoring your study to closely mirrors the actual marketplace.

Step 4: Calculate individual preference profiles
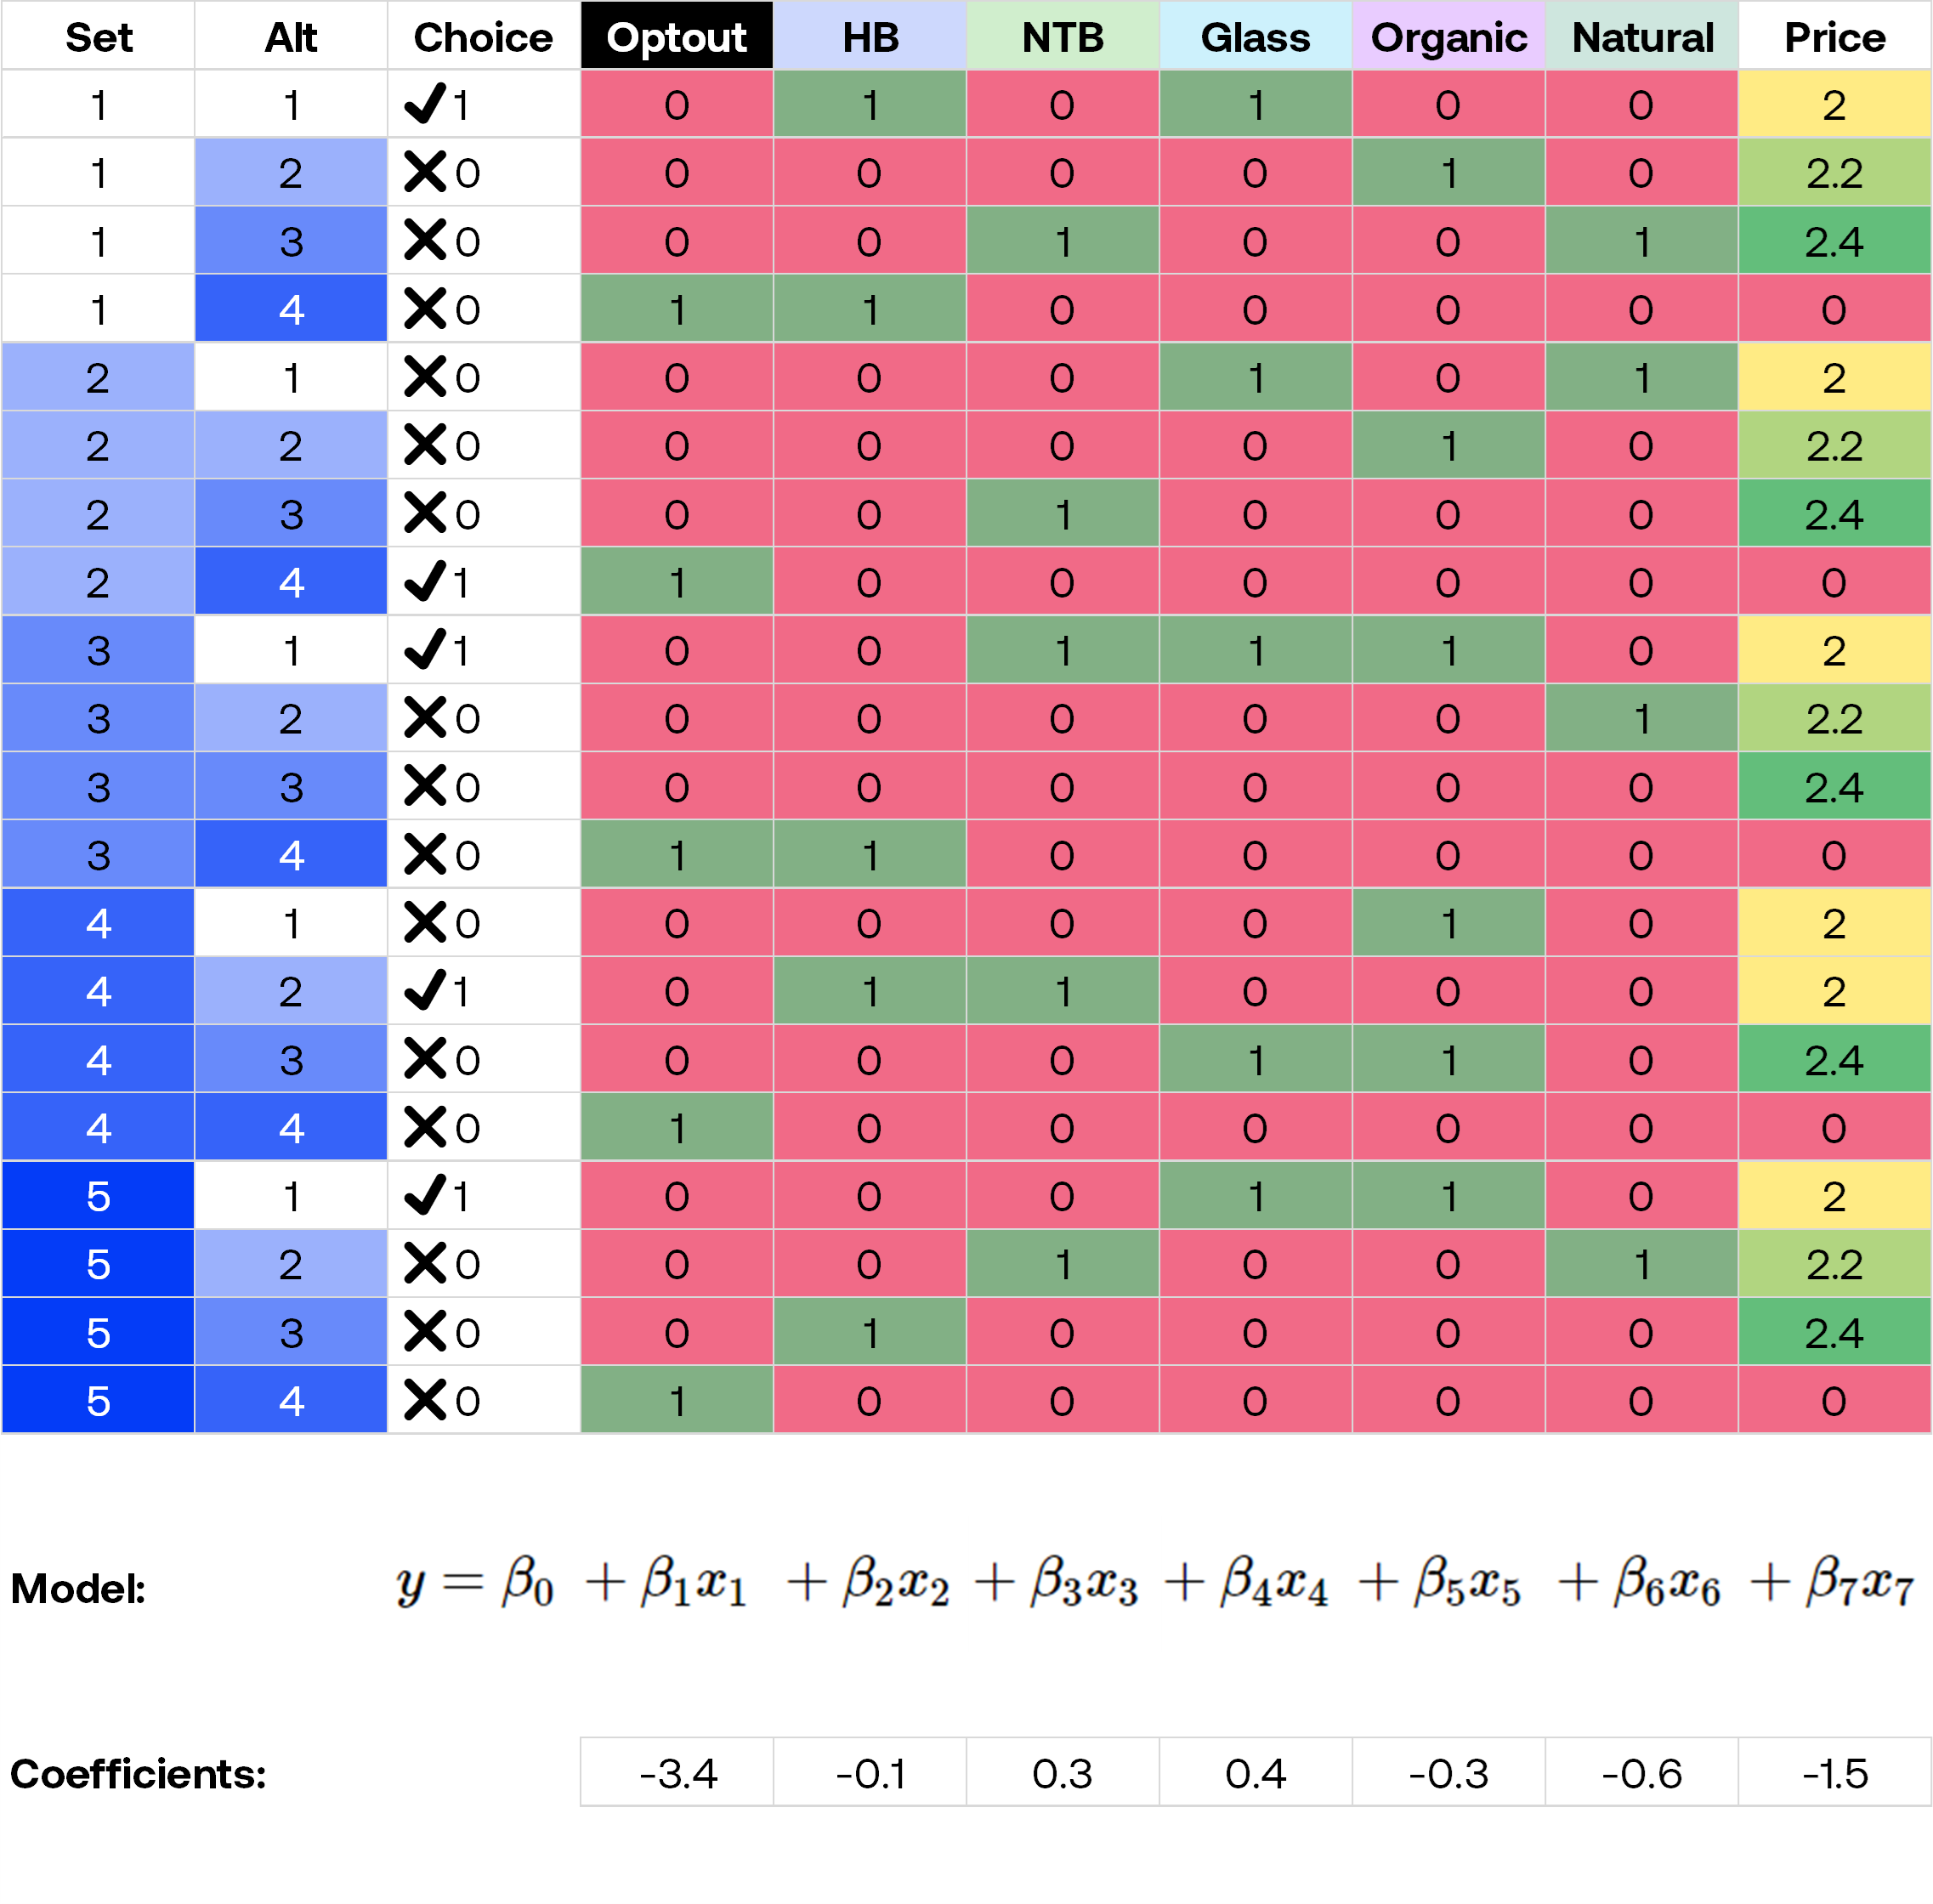
After collecting responses, the next step is to analyse the data and calculate individual preference profiles. This involves examining respondents’ choices and transforming the results into an estimated preference table to compute the coefficients (the relative individual preferences for each attribute level). These coefficients give an approximation of how popular an option is for respondents.
In the following simplified example, the coefficients based on 5 choice sets are computed using multiple linear regression.
Conjointly uses Markov Chain Monte Carlo Hierarchical Bayes (MCMC HB) estimation to compute relative individual preferences. With Conjointly, all the advanced statistical analyses are handled automatically, providing you with insightful outputs without the need for manual data crunching.
Step 5: Run various analysis
With the individual preference profiles, we can calculate utility scores (also known as part-worth utilities) for each respondent. These scores represent the relative importance of each attribute or level in driving respondents’ choices.
By aggregating the individual utility scores, we can also determine the overall preferences for the sample as a whole. This allows us to conduct various analyses, such as attribute importance, level performance, willingness to pay, and many more.
Make confident product and pricing decisions with conjoint analysis
Conjoint analysis can be daunting, but not with Conjointly. The platform will give you the actionable insights you need to make confident product and pricing decisions.
Identify the most influential product attributes
The relative importance by attribute output helps you identify which attributes matter most in your customers’ decision-making, allowing you to prioritise features that drive consumer preference. In this example, ‘Packaging material’ is the most important attribute at 27.2%, while ‘Eco label’ is the least important.

Uncover the top-performing options for each feature
By comparing the relative preferences for each attribute level, conjoint analysis reveals which options are most or least preferred to include in your product offering. In this example, ‘glass packaging’ is strongly preferred to ‘plastic packaging’ and somewhat preferred to ‘paper packaging’.

Understand consumer trade-offs
When price is included as an attribute and your study does not include competitor brands, SKUs, or pricing tiers, marginal willingness to pay (MWTP) will be computed. This provides you a directional estimate of how much your consumers are willing to pay to upgrade from the baseline to another attribute level. In this example, the median person values an upgrade from ‘plastic packaging’ to ‘glass packaging’ as much as they value a price drop by $0.60.

Find the optimal product configuration
Conjointly also generates a ranked list of product concepts as preferred by customers, enabling you to find the best product configuration based on the relative performance of all possible attribute level combinations. In this example, a Granny’s mix yoghurt of glass packaging, with Bifidobacteria + Lactobacilli, 150g, Eco label, and priced at $1.90 has the highest overall utilities across respondents. You can also conduct TURF analysis on attribute levels to identify the most appealing combinations of levels within each attribute.

Optimise product features and pricing through preference share simulations
Conjointly’s preference share simulation enables you to create multiple what-if scenarios by defining hypothetical product profiles using the attributes and levels from your study.

The system will estimate the percentage of respondents who would choose each product profile, allowing you to explore the impact of feature and pricing changes on consumer preferences and revenue.
Identify the optimal feature combinations
Through simulations, you can explore how changes in your attribute levels affect preference and revenue shares, enabling you to determine the optimal features and pricing for maximum preference share or revenue.

Determine the revenue maximising price point
The simulator also helps you measure price elasticity of demand, reveal how sensitive your customers are to price changes. This simulation also allows you to identify the price point that maximises revenue or profit.

Assess the potential of new product launches
When considering new product ideas, the simulator enables you to measure the level of consumer interest and compare it with your current offerings. This helps you estimate the adoption rate of your new product and make informed decisions about product development and launch strategies.

Talk to an expert about conjoint analysis
Are you looking to optimise your product feature or pricing using conjoint analysis? Or have any burning questions? Conjointly’s team of research experts are here to help.
The best way to learn more about conjoint analysis is to set up your own study, which you can do when you sign up with us. You can also read about: