Discover the key differences between four conjoint-based pricing research methods, namely Generic Conjoint, Brand-Specific Conjoint, Brand-Price Trade Off, and Brand-Price Trade-Off with Linear Coefficients.
Brand-Price Trade-Off
Test pricing of new and existing consumer goods in a competitive context using elasticity charts, revenue, and profitability projections.
Conjointly offers several ways to run conjoint analysis for pricing in competitive contexts. If you are not familiar with them, see the Appendix. This blogpost compares their results.
We conducted four conjoint-based pricing studies:
- Generic Conjoint (GC, example link),
- Brand-Specific Conjoint (BSC, example link),
- Brand-Price Trade-Off (BPTO, example link), and
- Brand-Price Trade-Off with Linear Coefficients (BPTO LC, example link).
In all the studies respondents faced the same discrete choice experiment where they selected their most preferred toothpaste brand-price combination. The tested price schedule for brands were common across experiments, as well as the price schedule for the simulations we ran afterwards. We tested five price points per brand with ₤0.25 increments with the same price range that appears in PED calculations. The only major variation was the methodology of testing.
Sample and structure of the survey
All the four studies were conducted in the UK between March 25th and 31st of 2025, for the 16+ age group, with a nationally representative sample of 600 respondents in each.
The studies consist of:
- Demographic questions.
- Category usage questions which test awareness and usage of one private label and top 5 toothpaste brands in the UK by market share.
- Conjoint exercise during which respondents are presented with 4 alternatives in each choice set. Alternatives consist of a brand and a price per bottle of 100 ml. Each brand is tested on 5 price points where the middle price is the average price per bottle in the market.
- Diagnostic questions about premium perception, value for money, purchase intent, and open ended feedback.
Set-up of the conjoints
Below are the set-ups of the conjoint exercises.
1. Generic Conjoint set-up
Generic conjoint is set up with 5 price points, where the middle price is normalized to 1 and 10% price deviation is applied around this price.
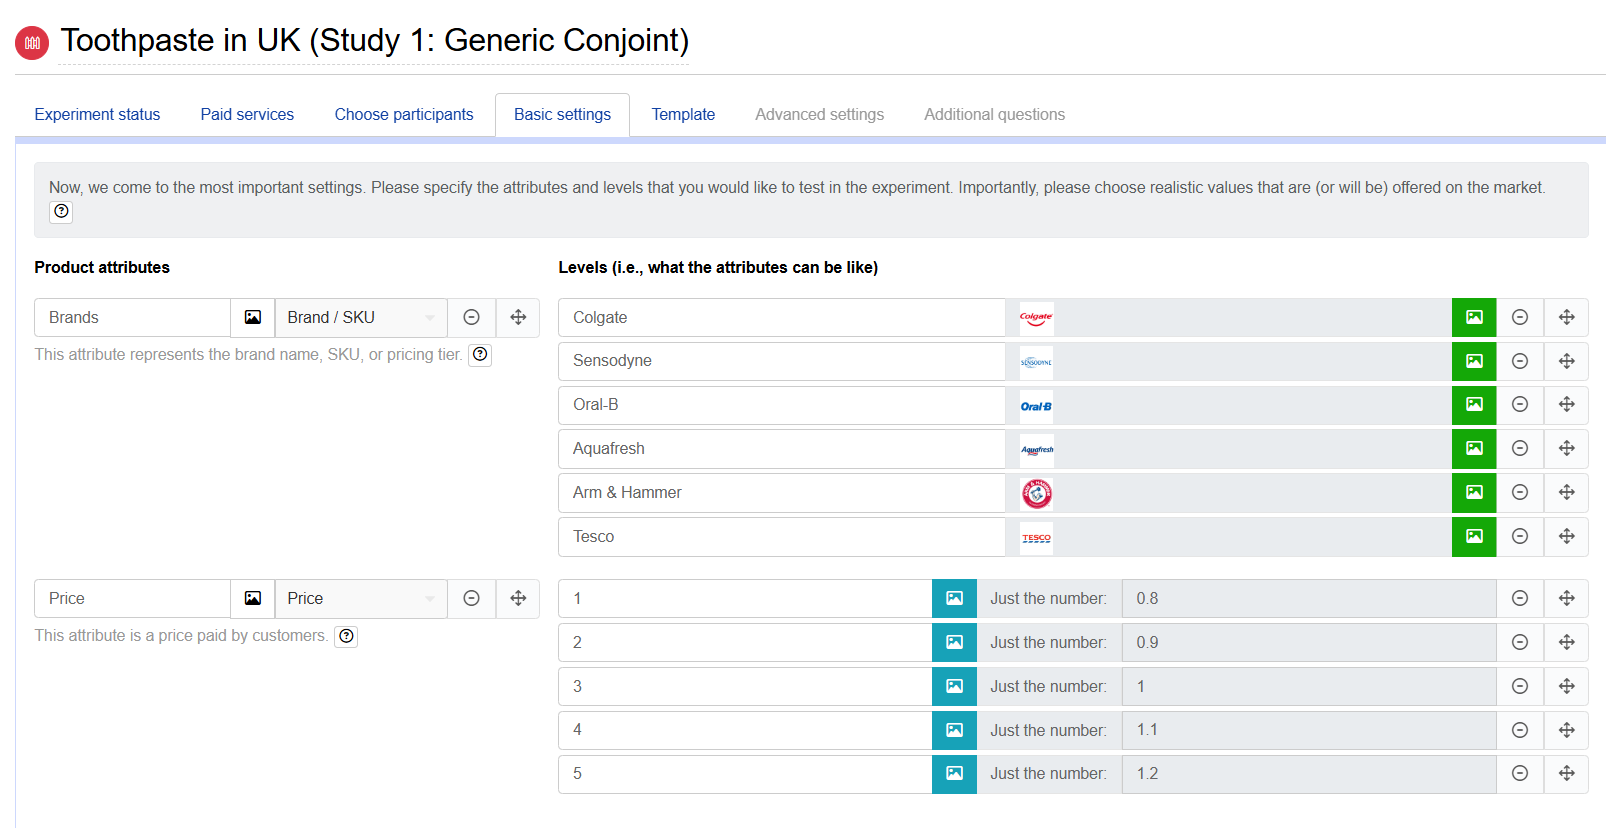
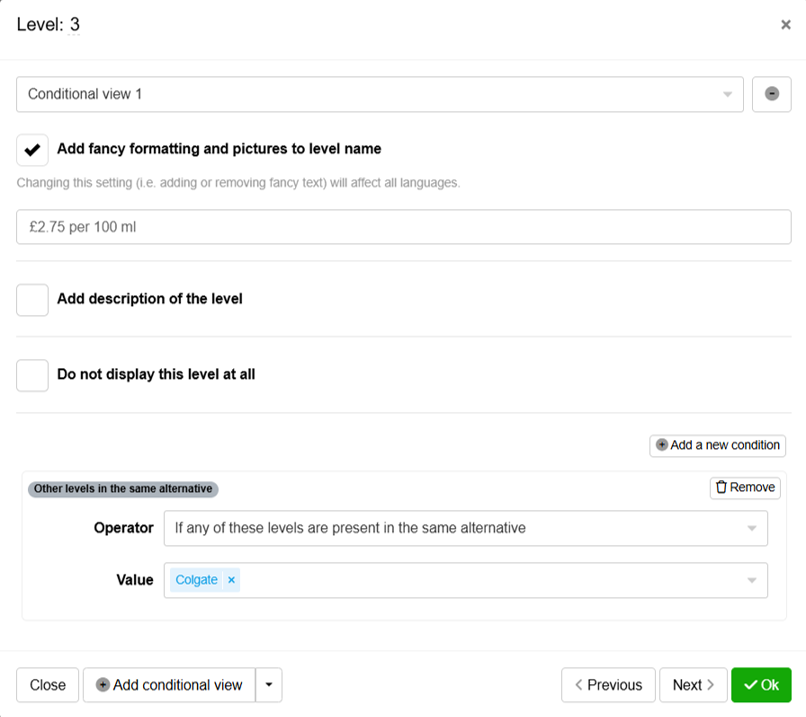
Conditional view is used to display the actual prices for each brand:
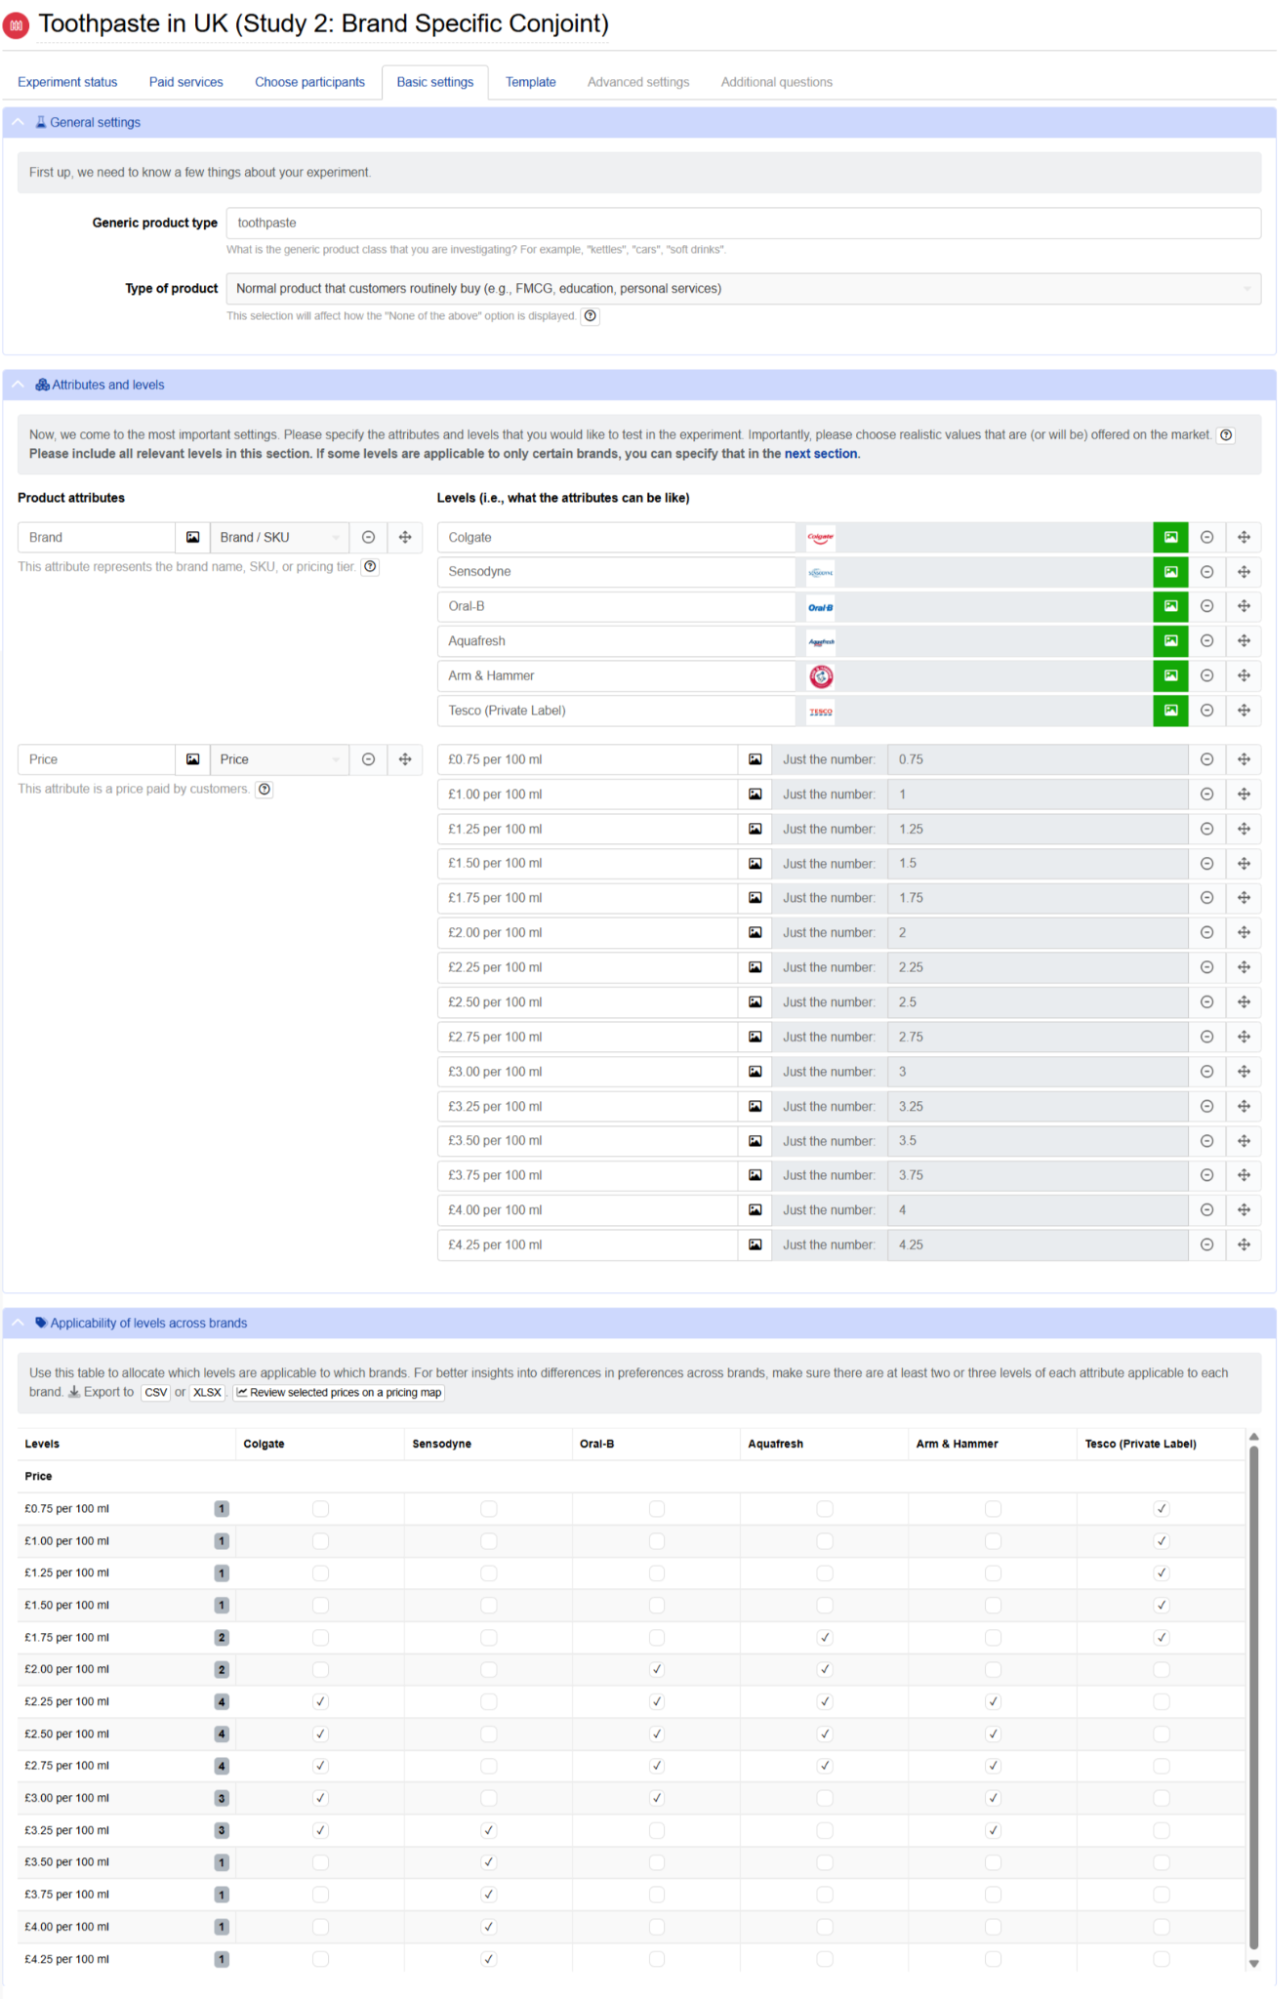
2. Brand-Specific Conjoint set-up
In the BSC set-up, all prices are first entered in the price attribute, after which the price applicability for each brand is then determined.
3. Brand-Price Trade-Off set-up
In the BPTO, all prices are first entered, after which the price applicability for each brand is then determined.

4. Brand-Price Trade-Off with Linear Coefficients set-up
In the BPTO LC, all prices are first entered, after which the price applicability for each brand is then determined.

Simulation results
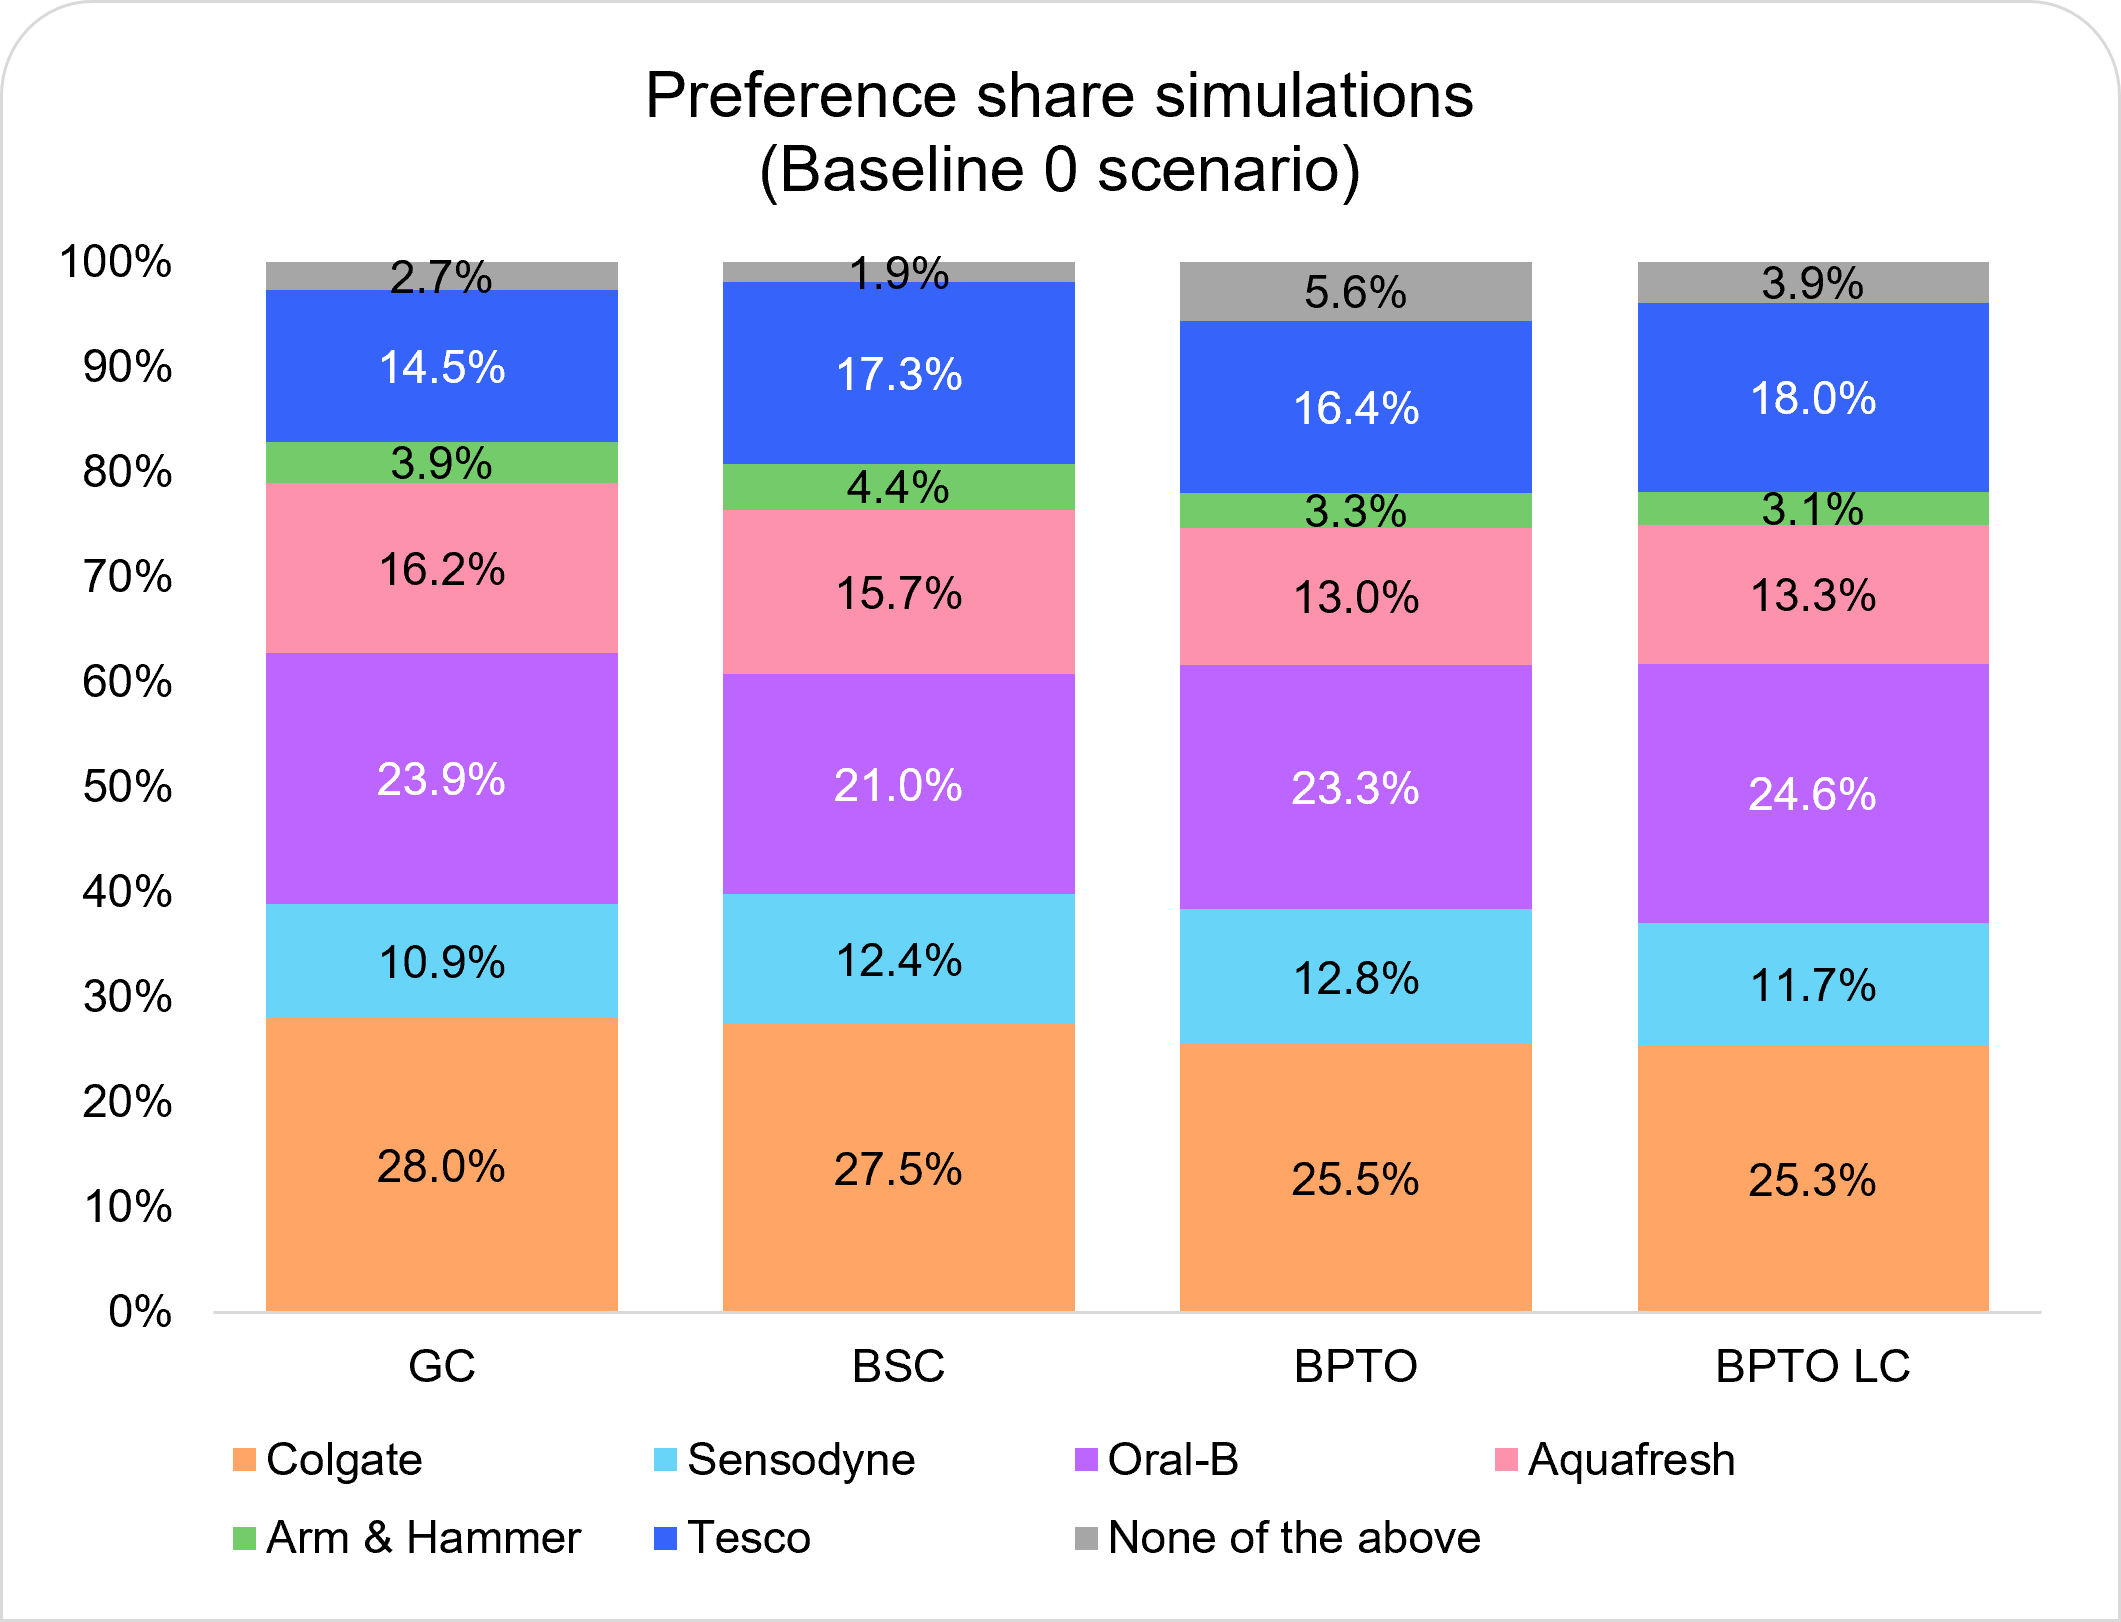
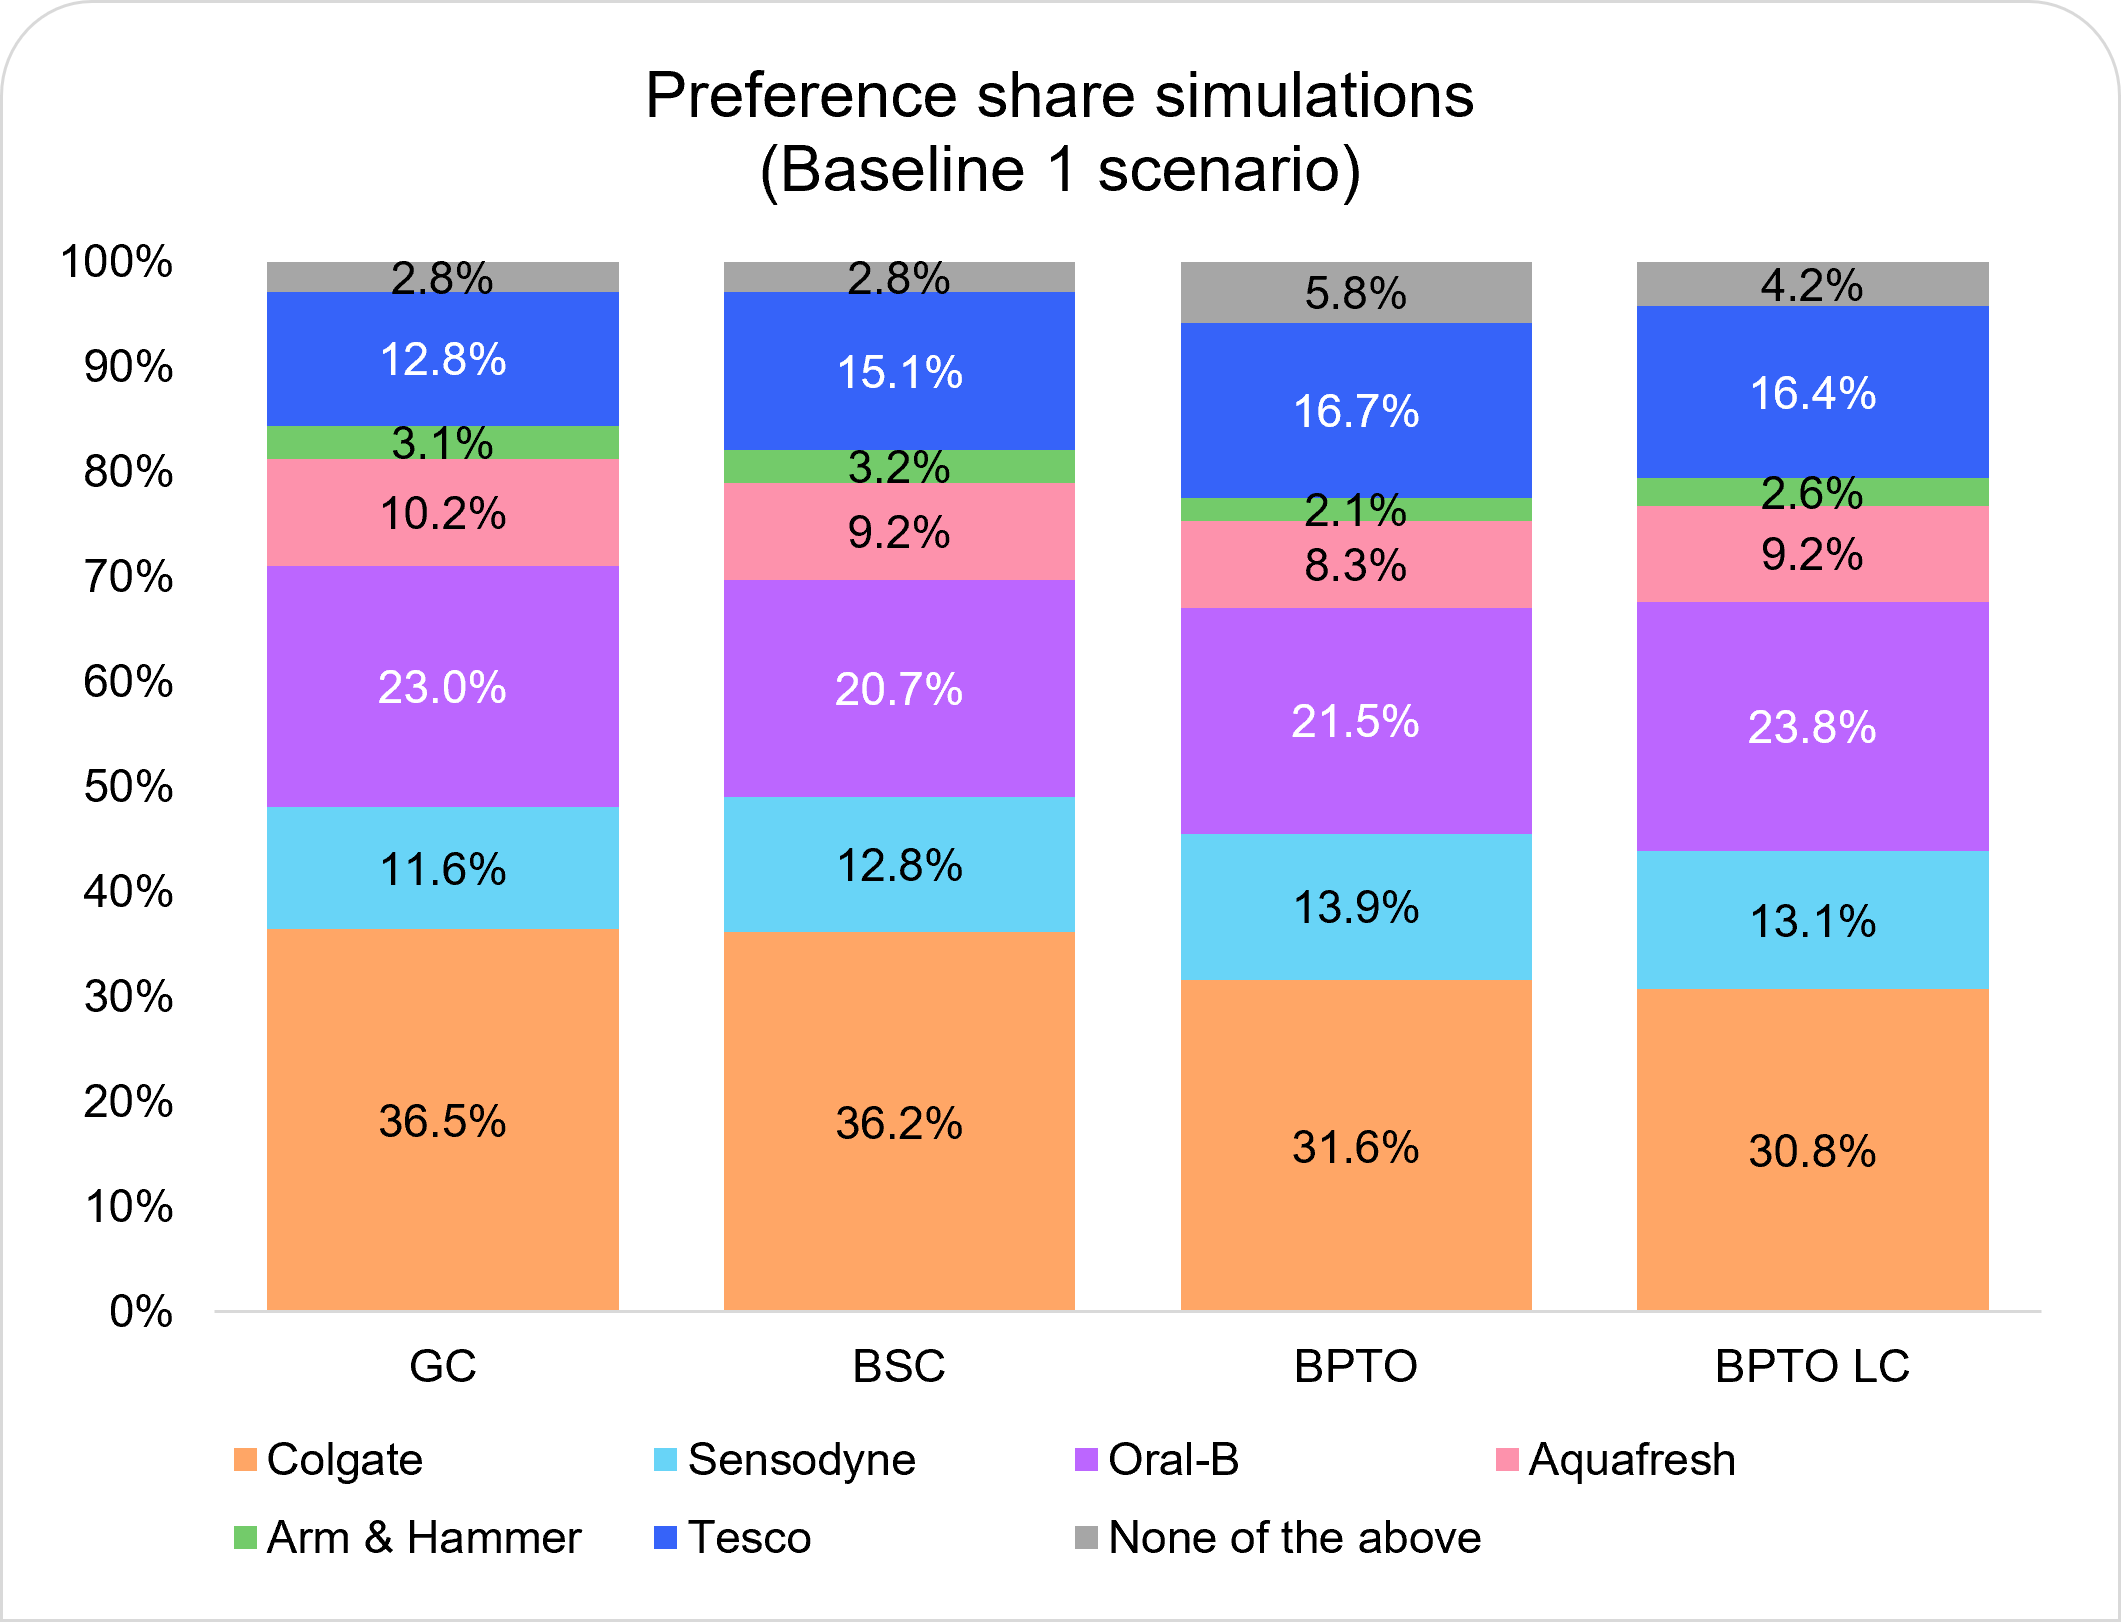
We run two baseline simulations with the price schedule in the table below. Simulations produce preference shares, and revenue projections. For each baseline, we also run price sensitivity analysis which produces Price Elasticity of Demand for each brand.
| SIMULATION PRICES | ||||
|---|---|---|---|---|
| Brand | Baseline 0 | Baseline 1 | ||
| Price index (used in GC) | Price level | Price index (used in GC) | Price level | |
| Colgate | 1 | £2.75 | 0.9 | £2.50 |
| Sensodyne | 1 | £3.75 | 0.9 | £3.50 |
| Oral-B | 1 | £2.50 | 1 | £2.50 |
| Aquafresh | 1 | £2.25 | 1.1 | £2.50 |
| Arm & Hammer | 1 | £2.75 | 1.1 | £3.00 |
| Tesco | 1 | £1.25 | 1.1 | £1.50 |
Preference shares
Price elasticity of demand (summary table)
| PRICE ELASTICITY OF DEMAND | |||||||||
|---|---|---|---|---|---|---|---|---|---|
| Brand | Baseline 0 | Baseline 1 | Price Range | ||||||
| GC | BSC | BPTO | BPTO LC | GC | BSC | BPTO | BPTO LC | ||
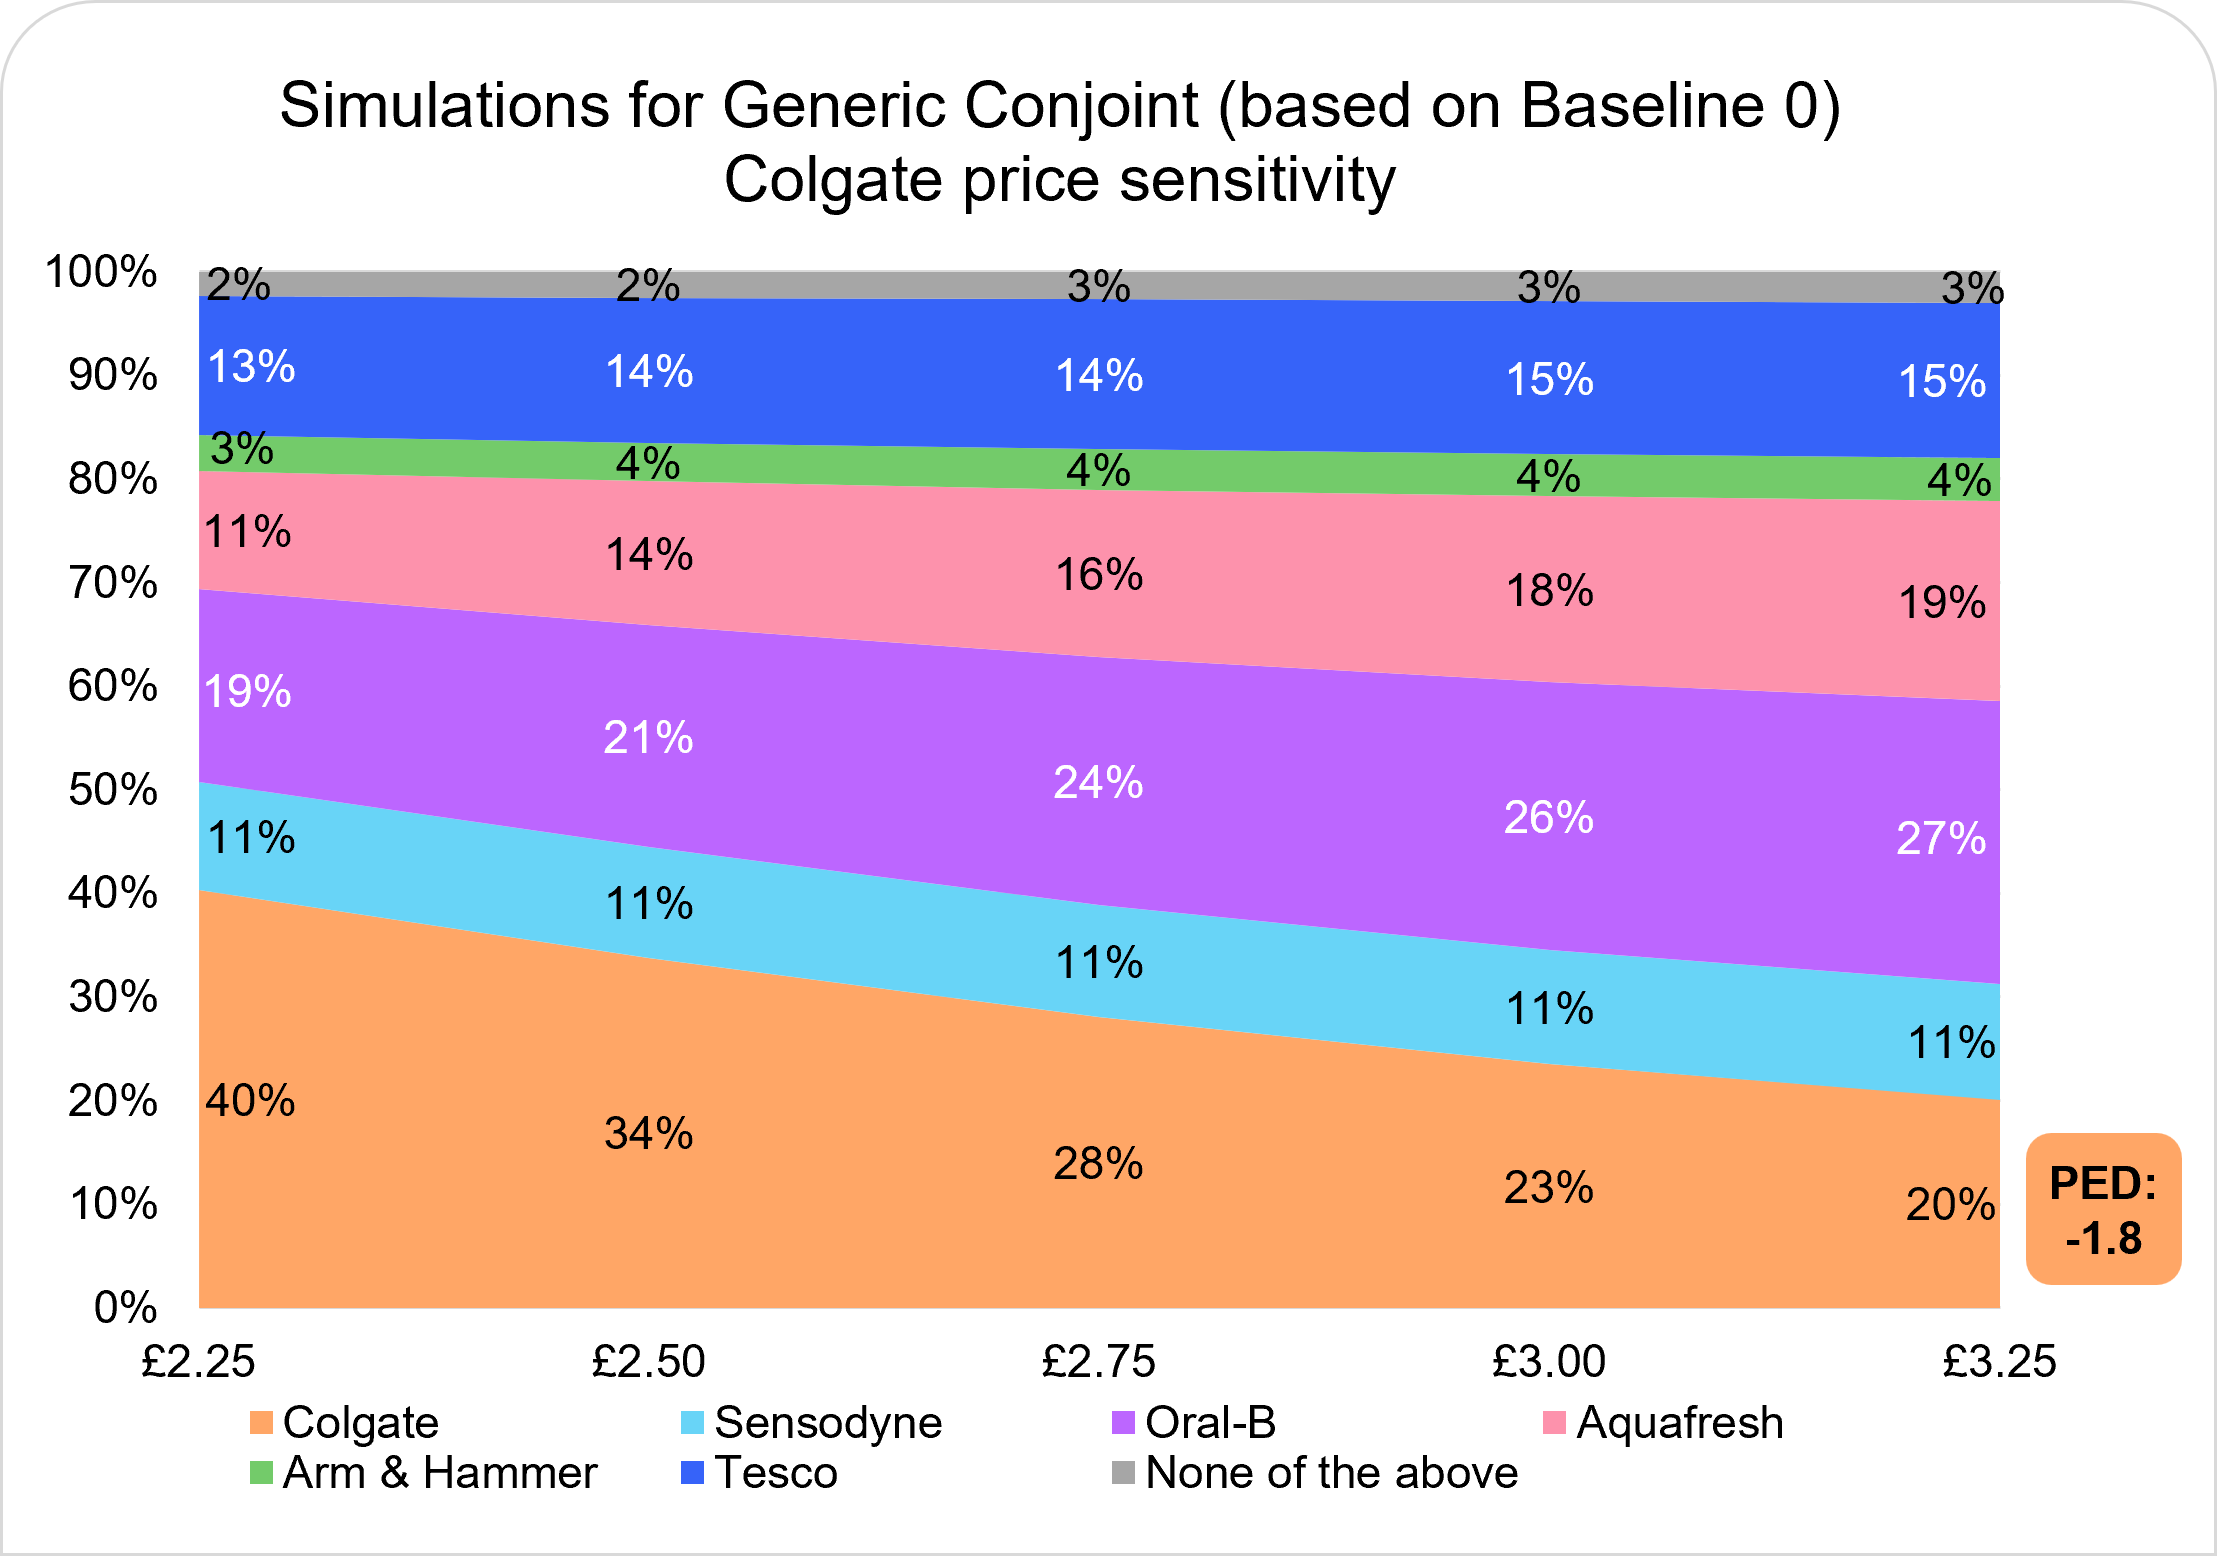
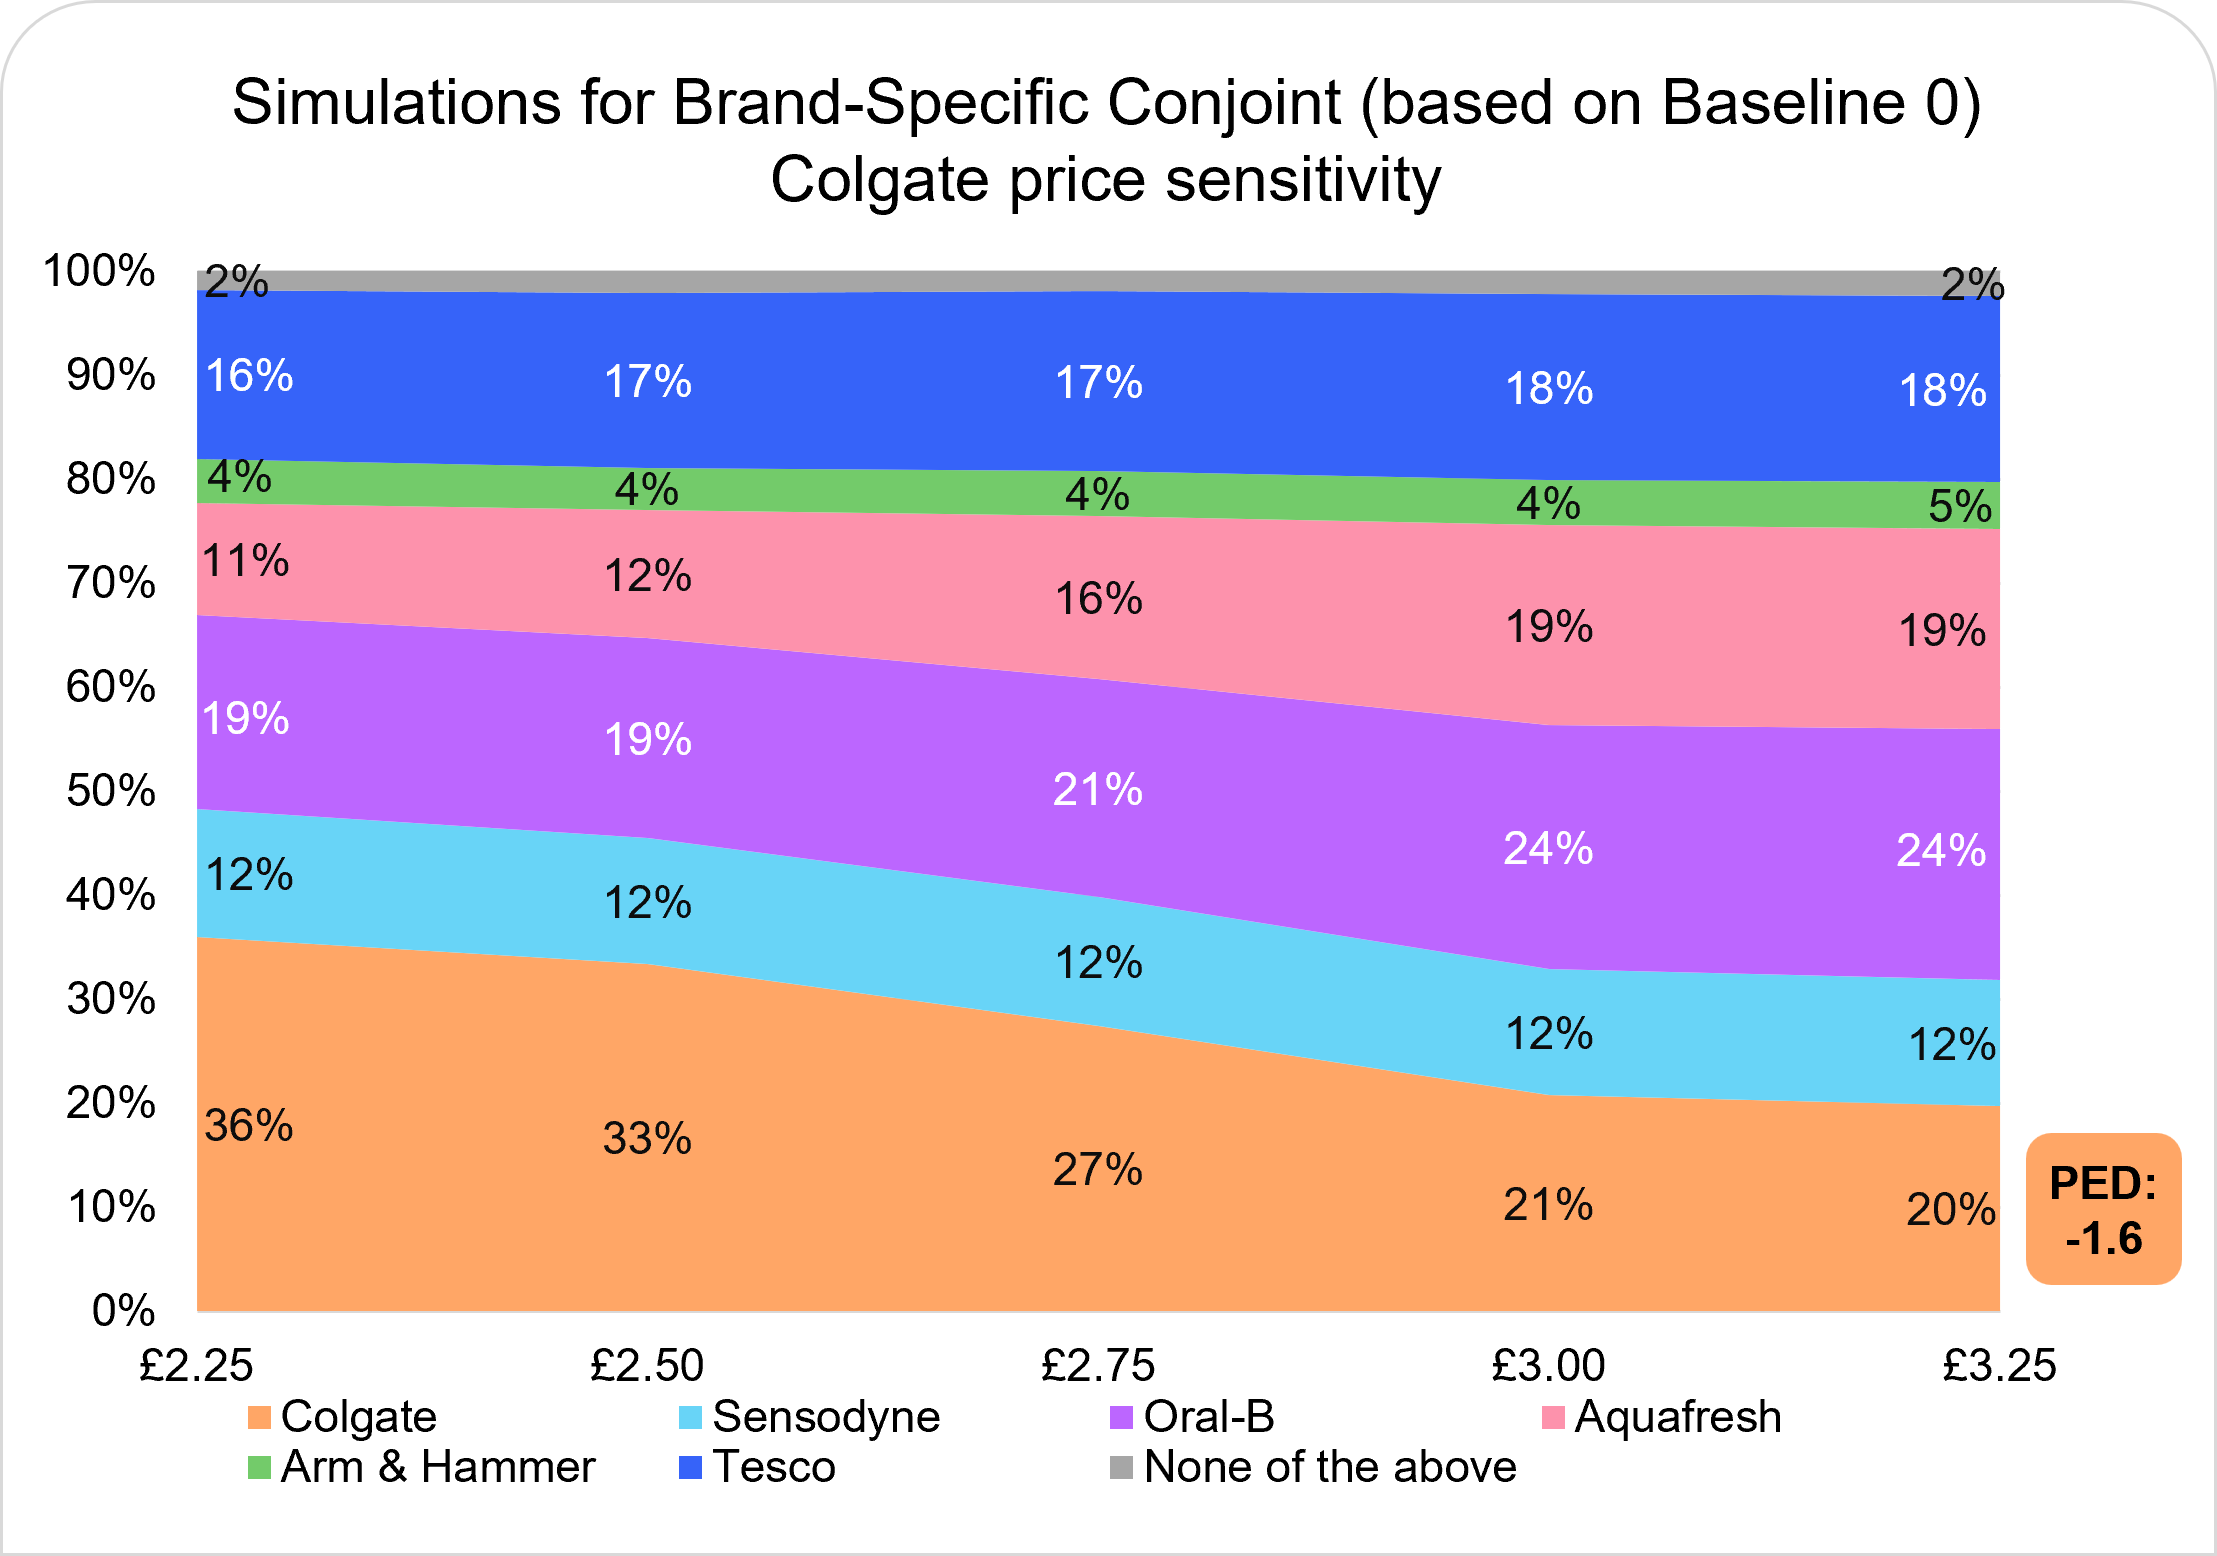
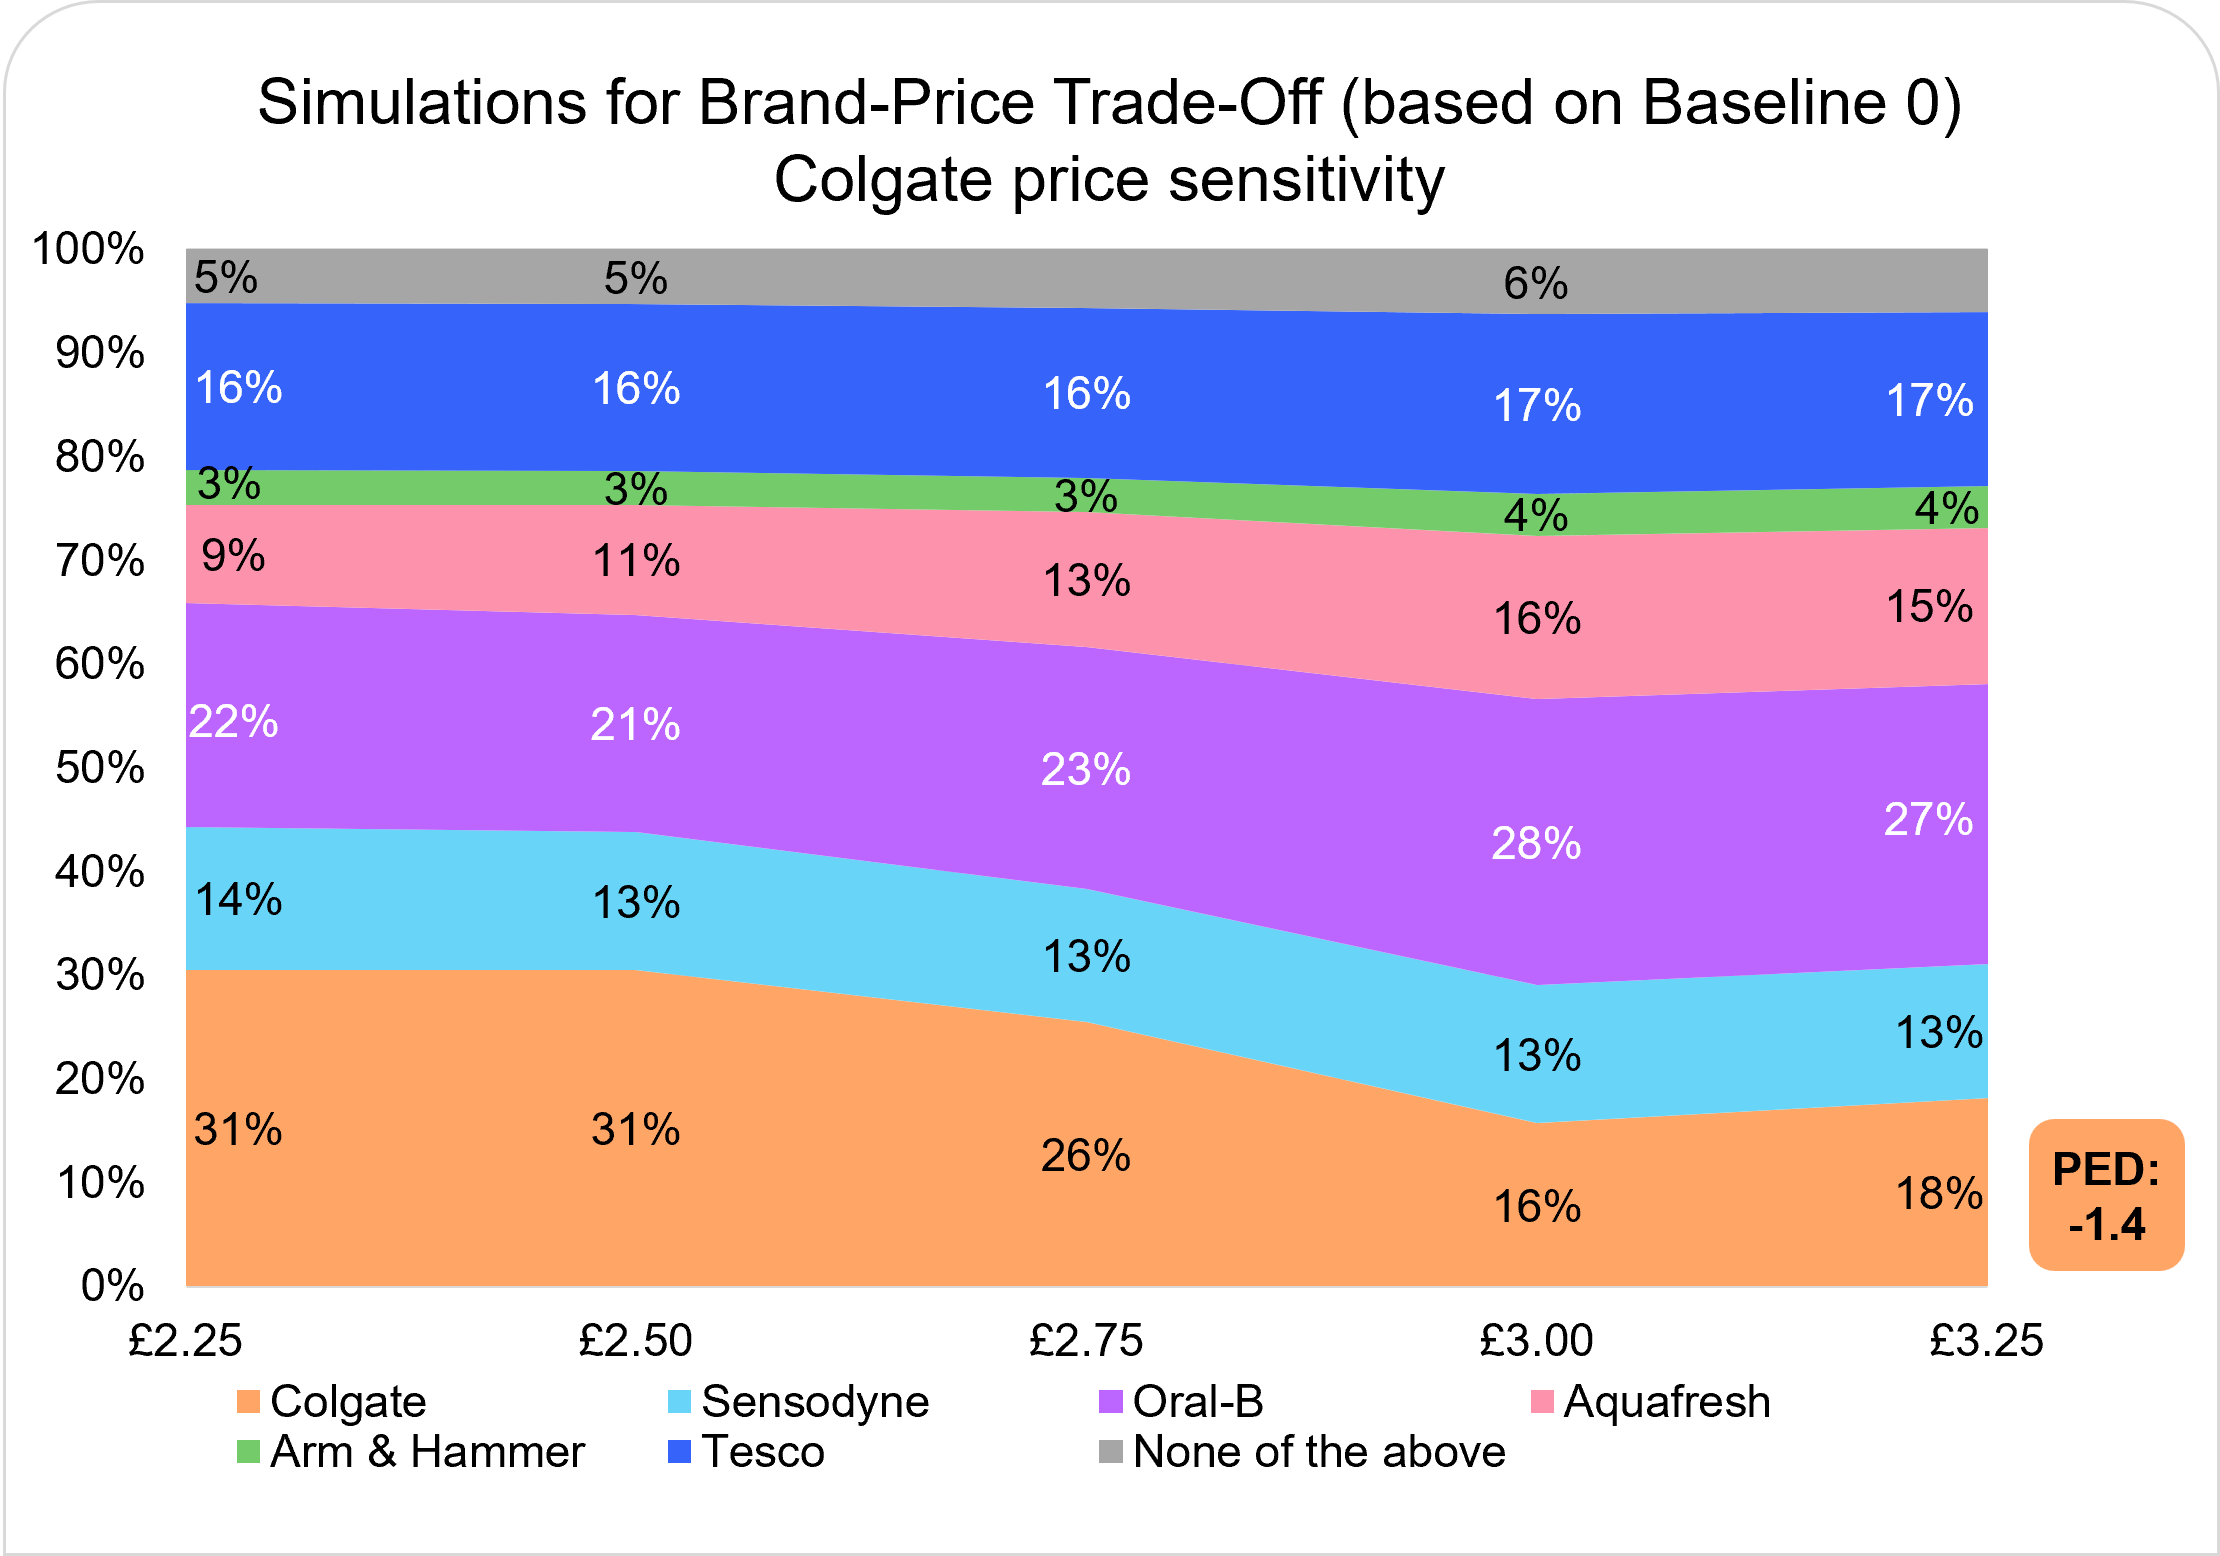
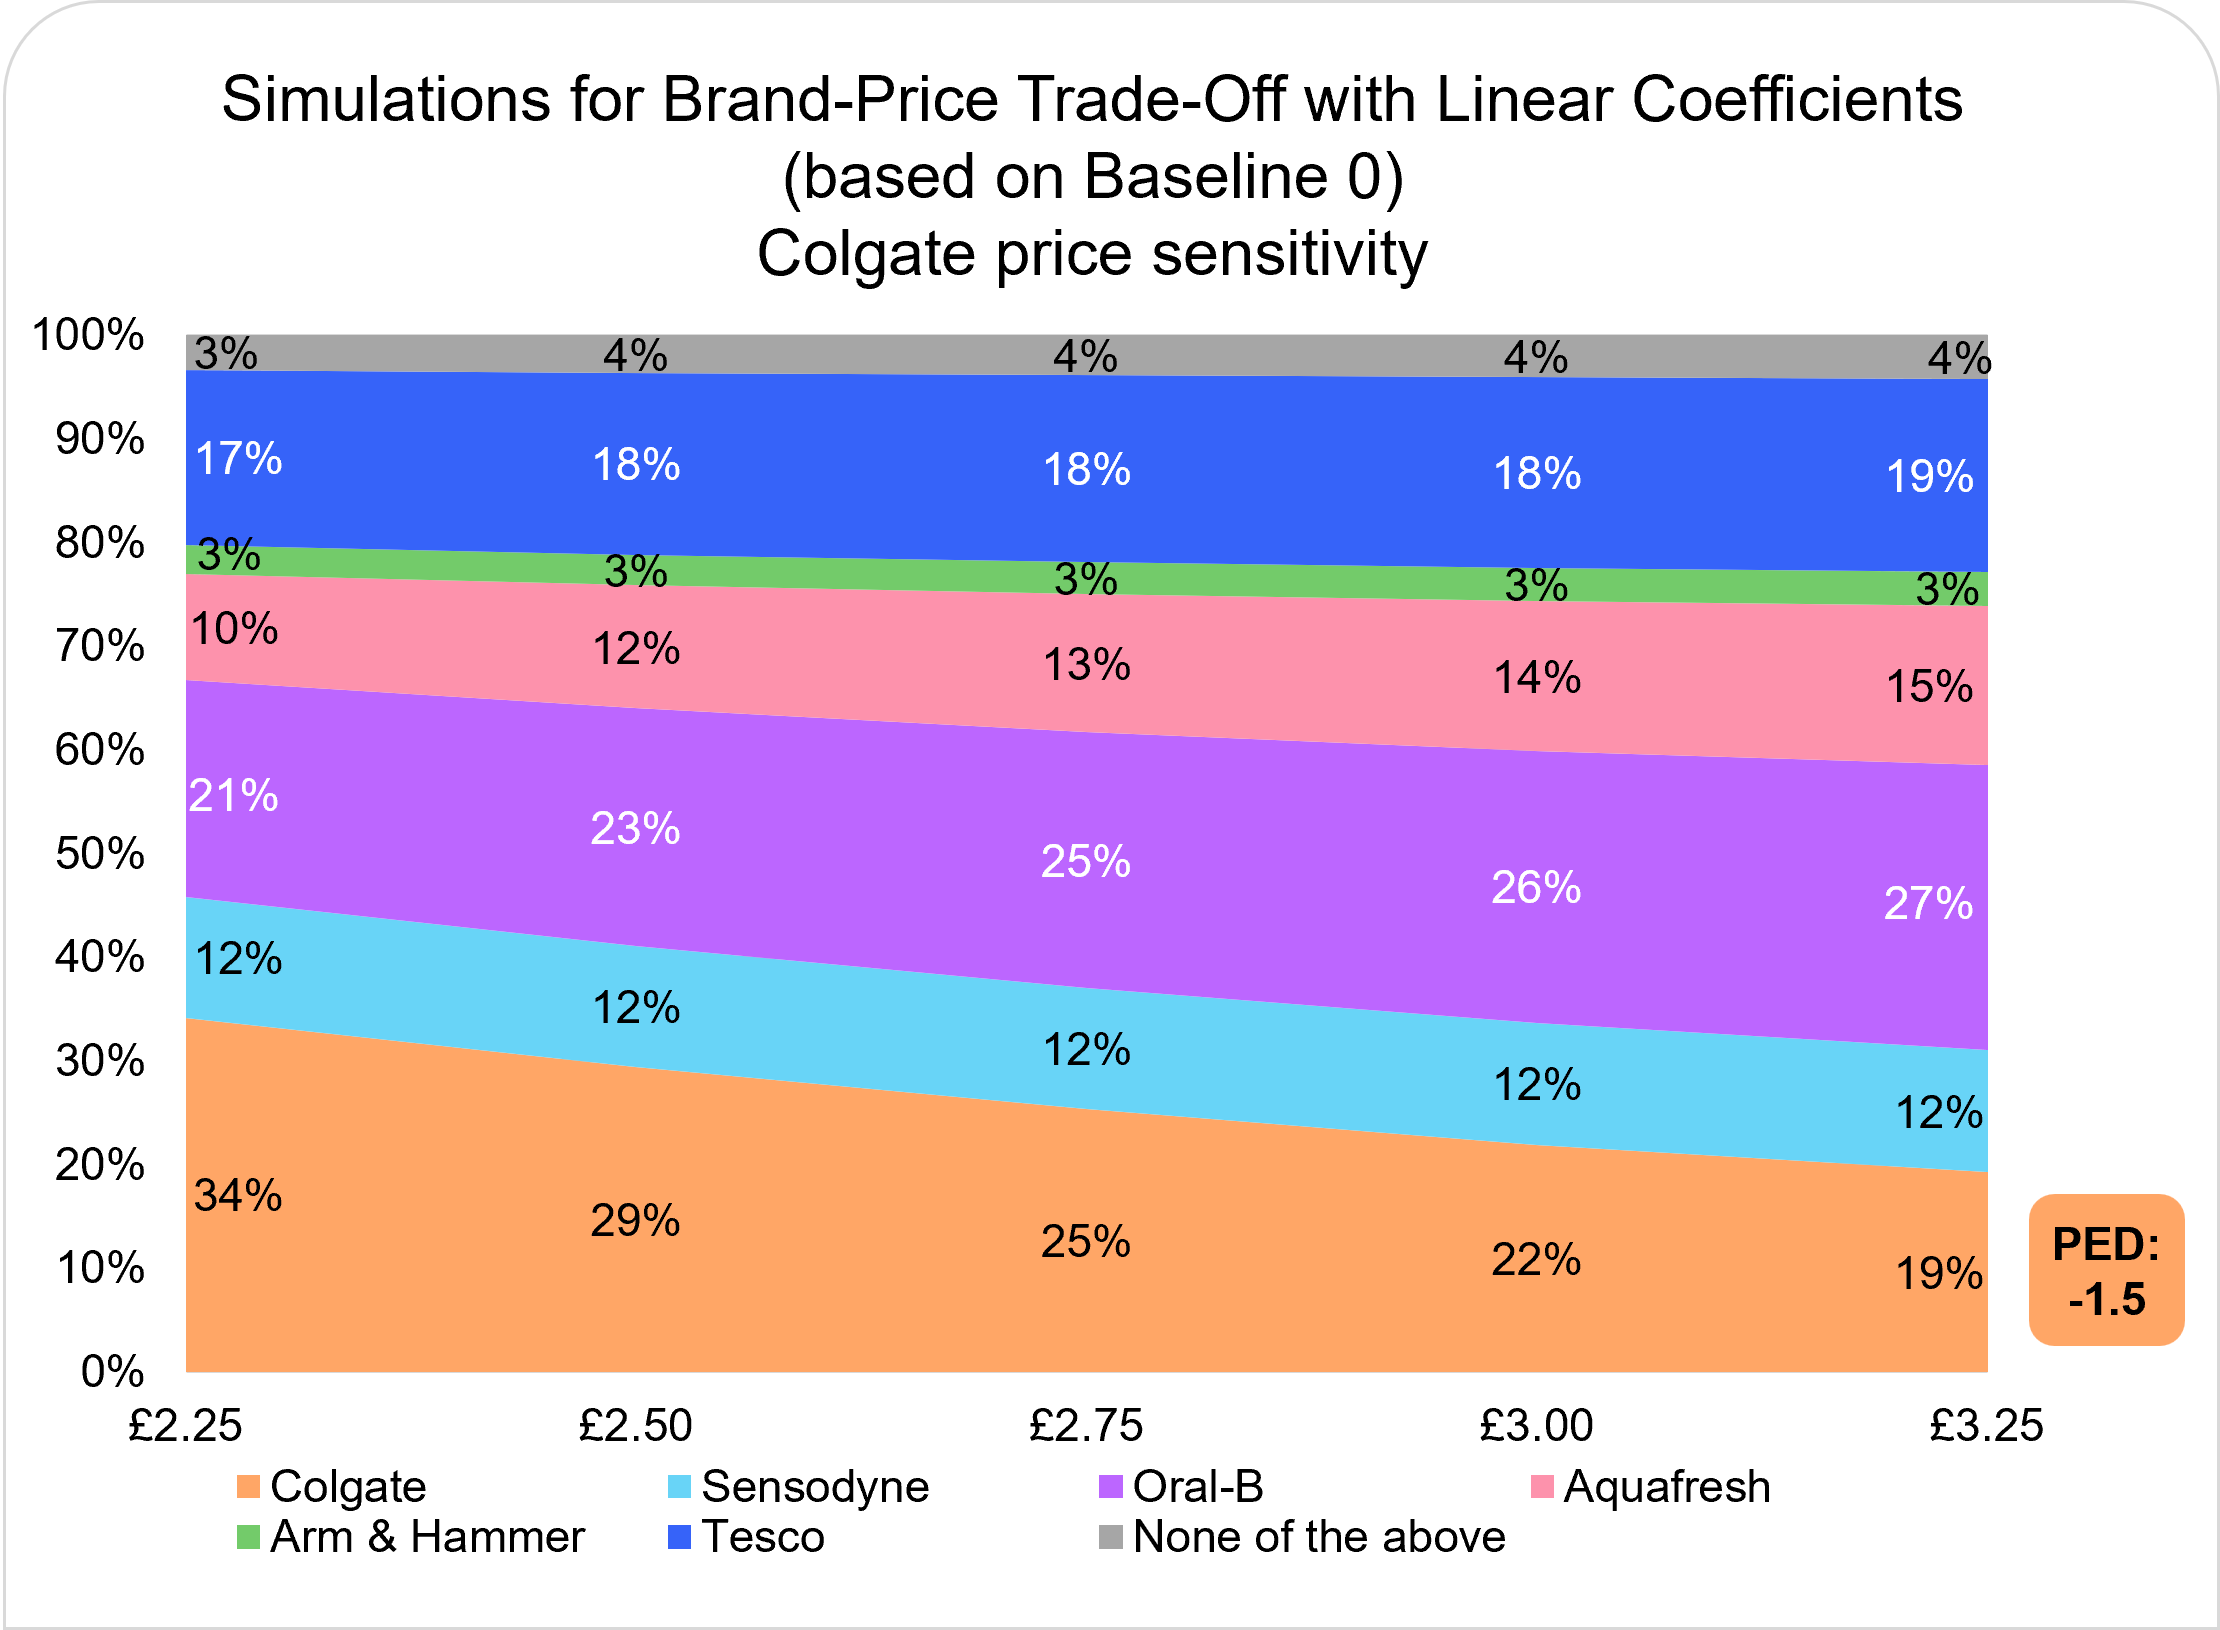
| Colgate | -1.8 | -1.6 | -1.4 | -1.5 | -1.9 | -1.8 | -1.5 | -1.6 | £2.25 - £3.25 |
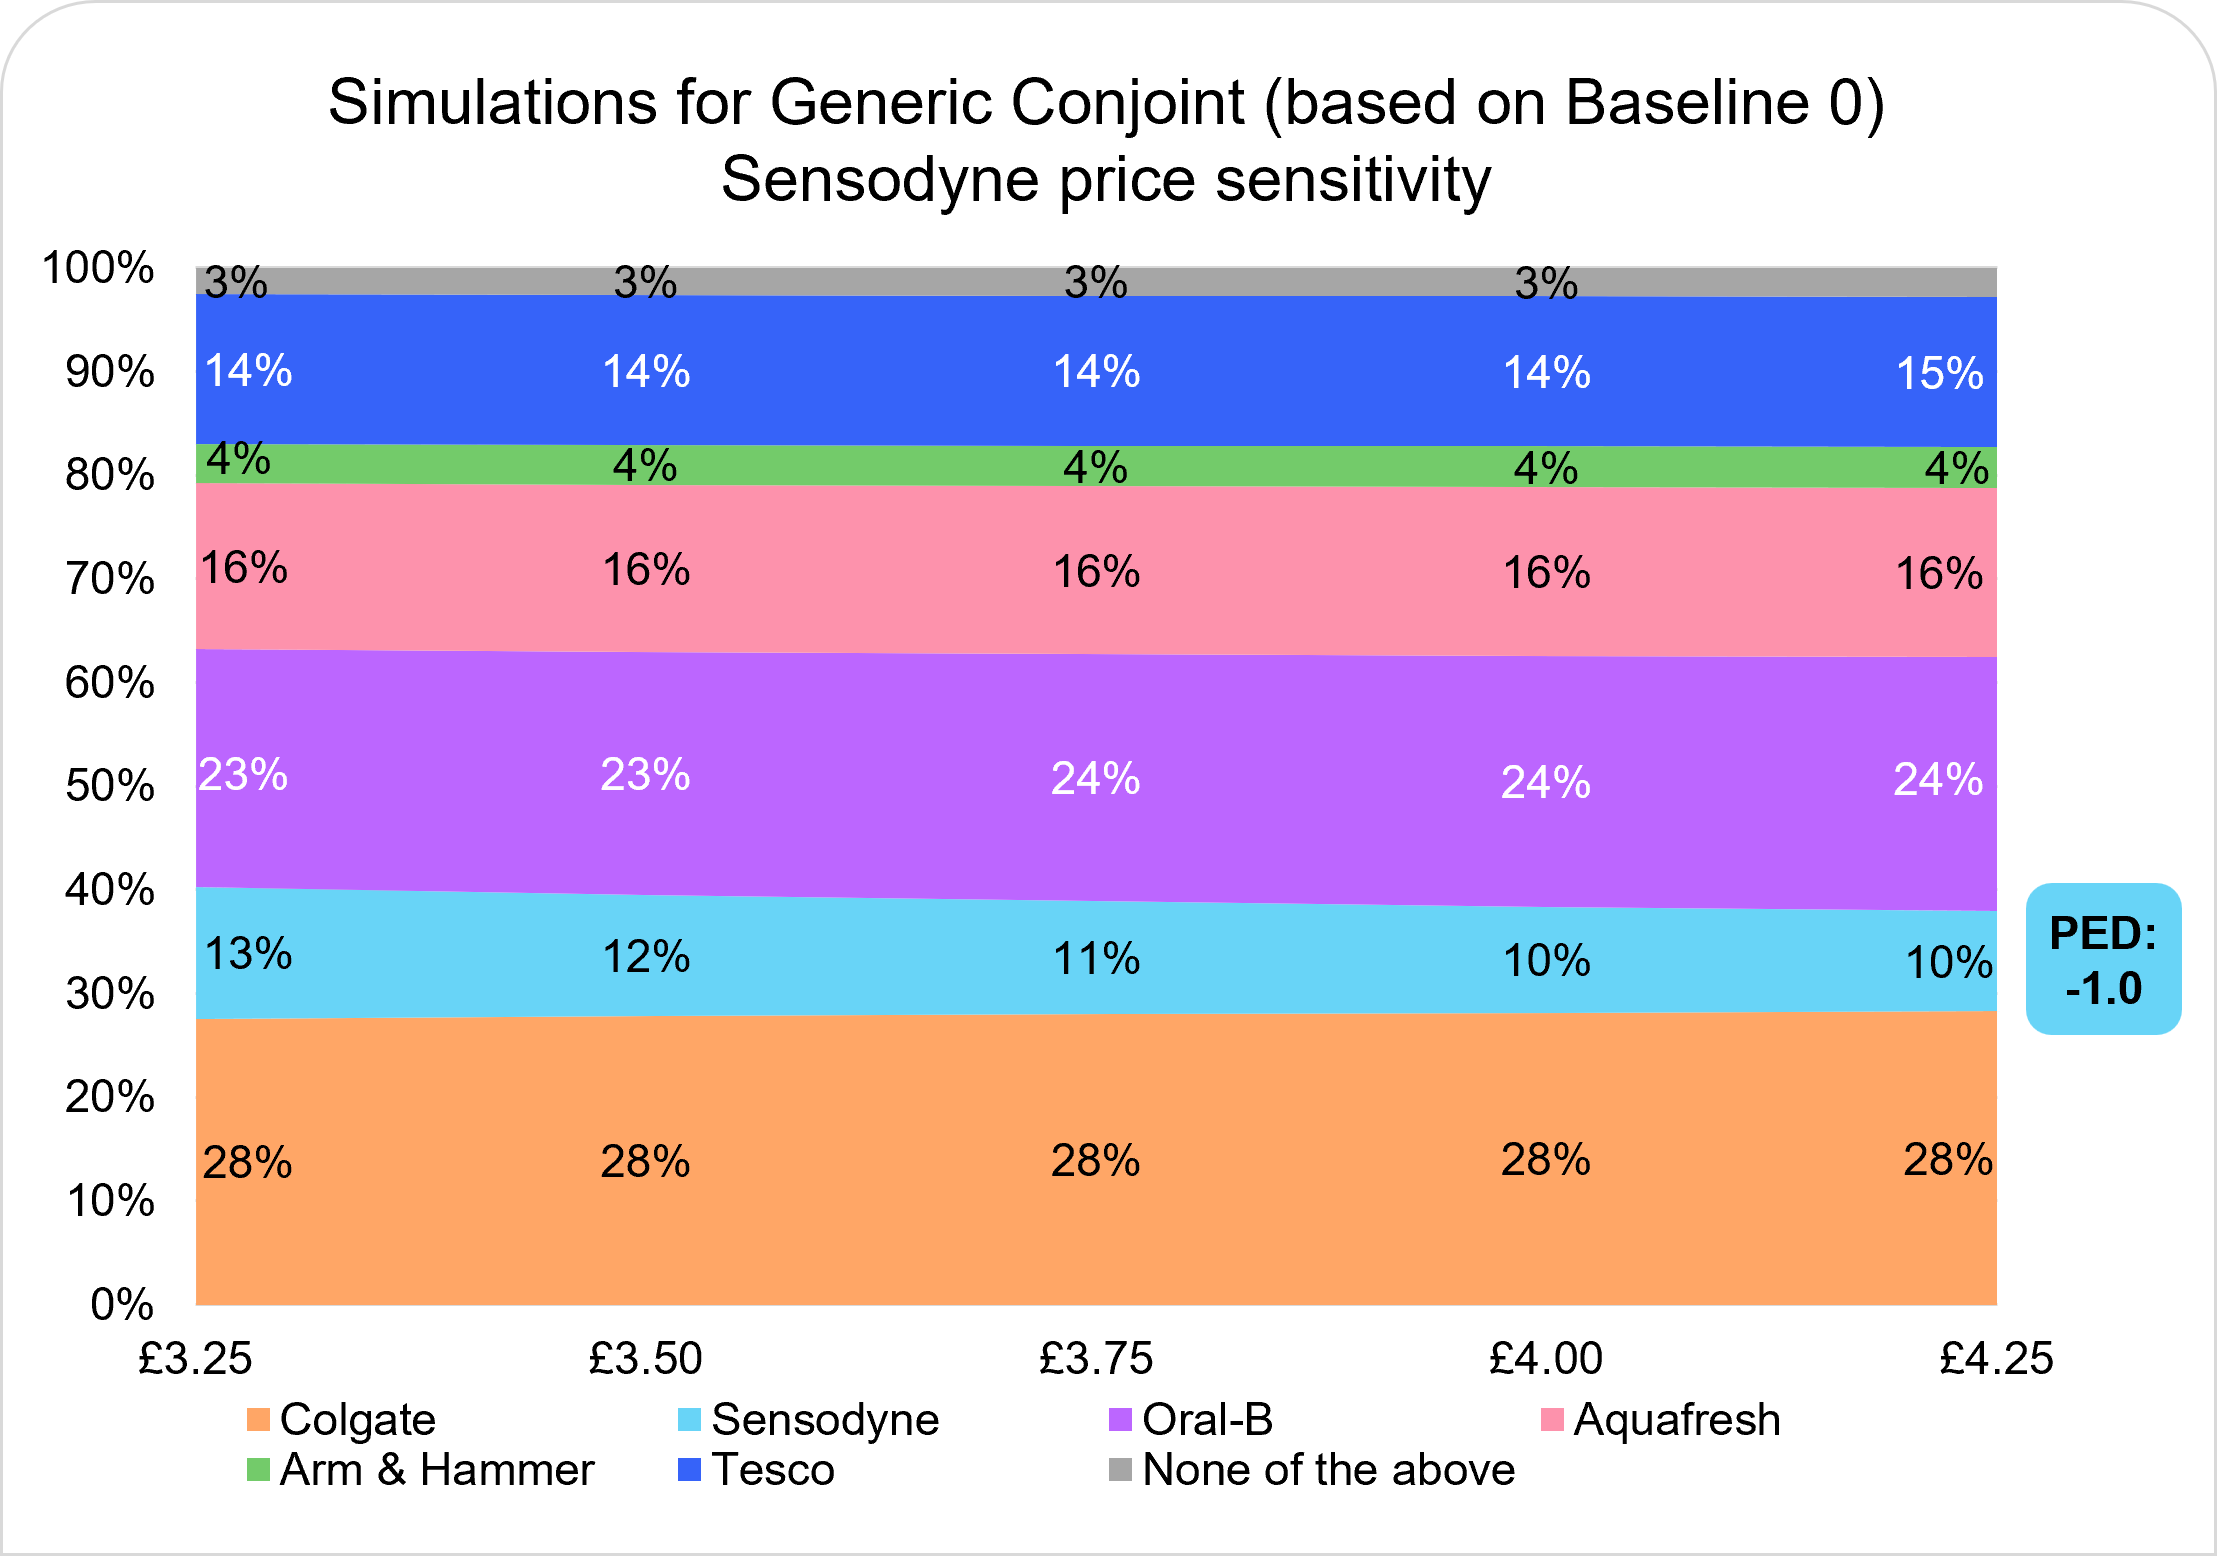
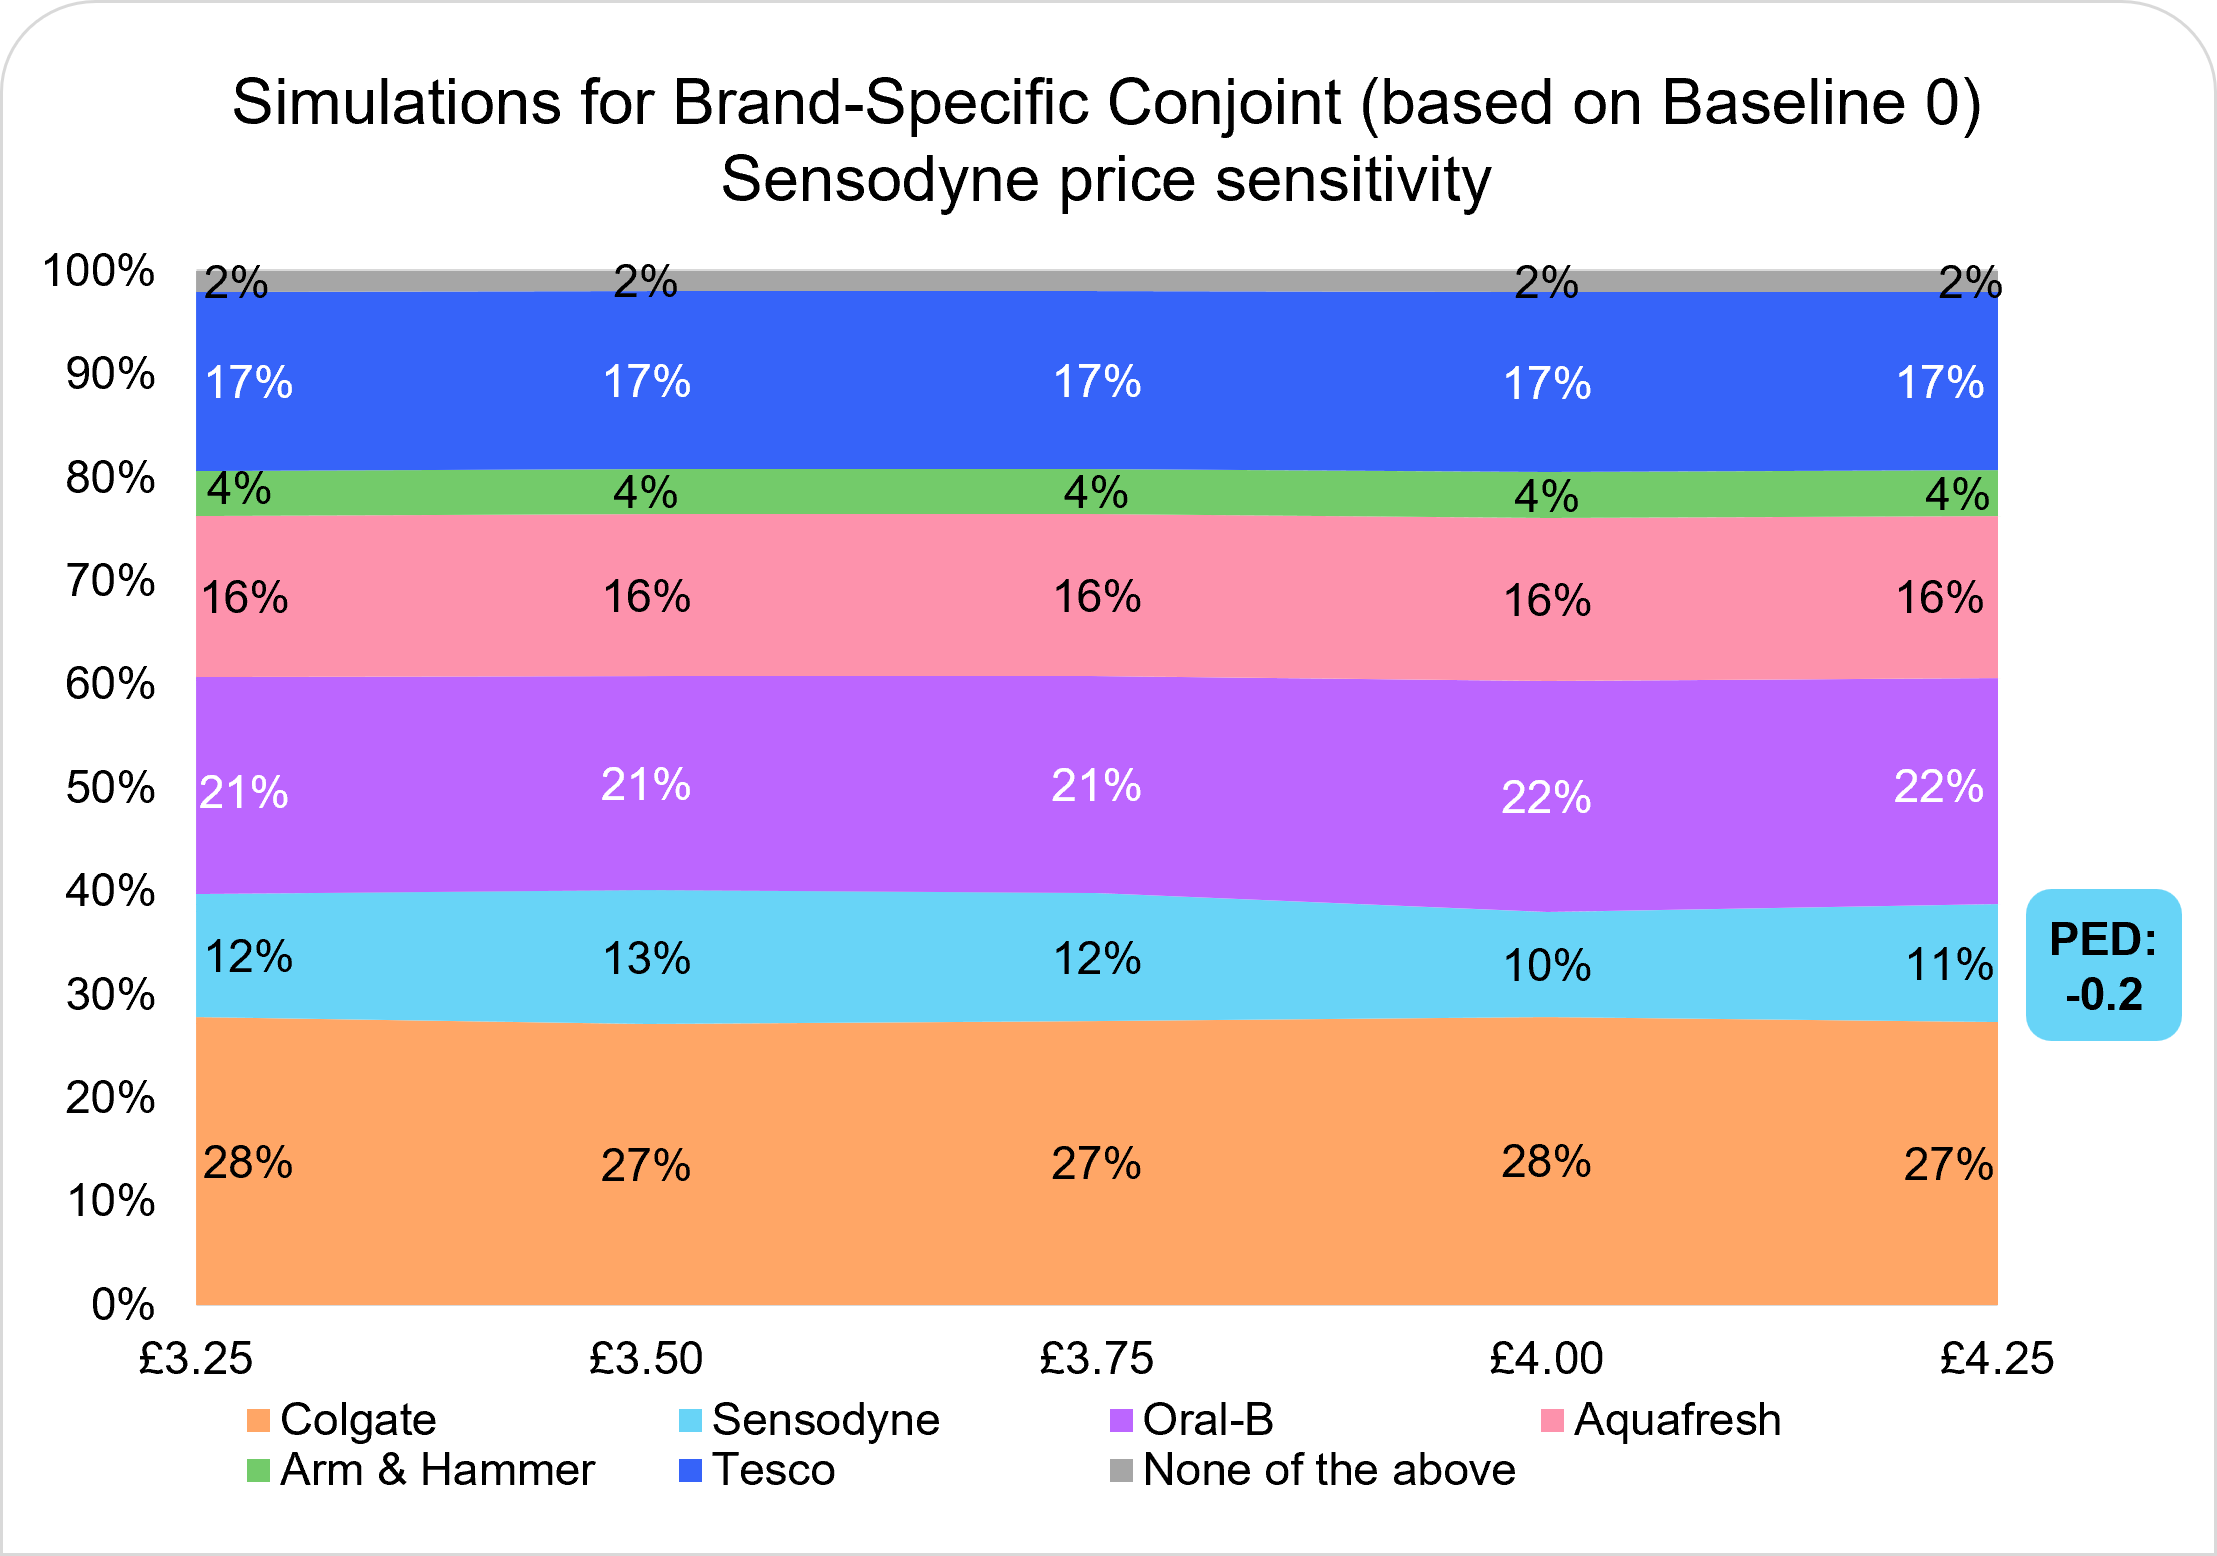
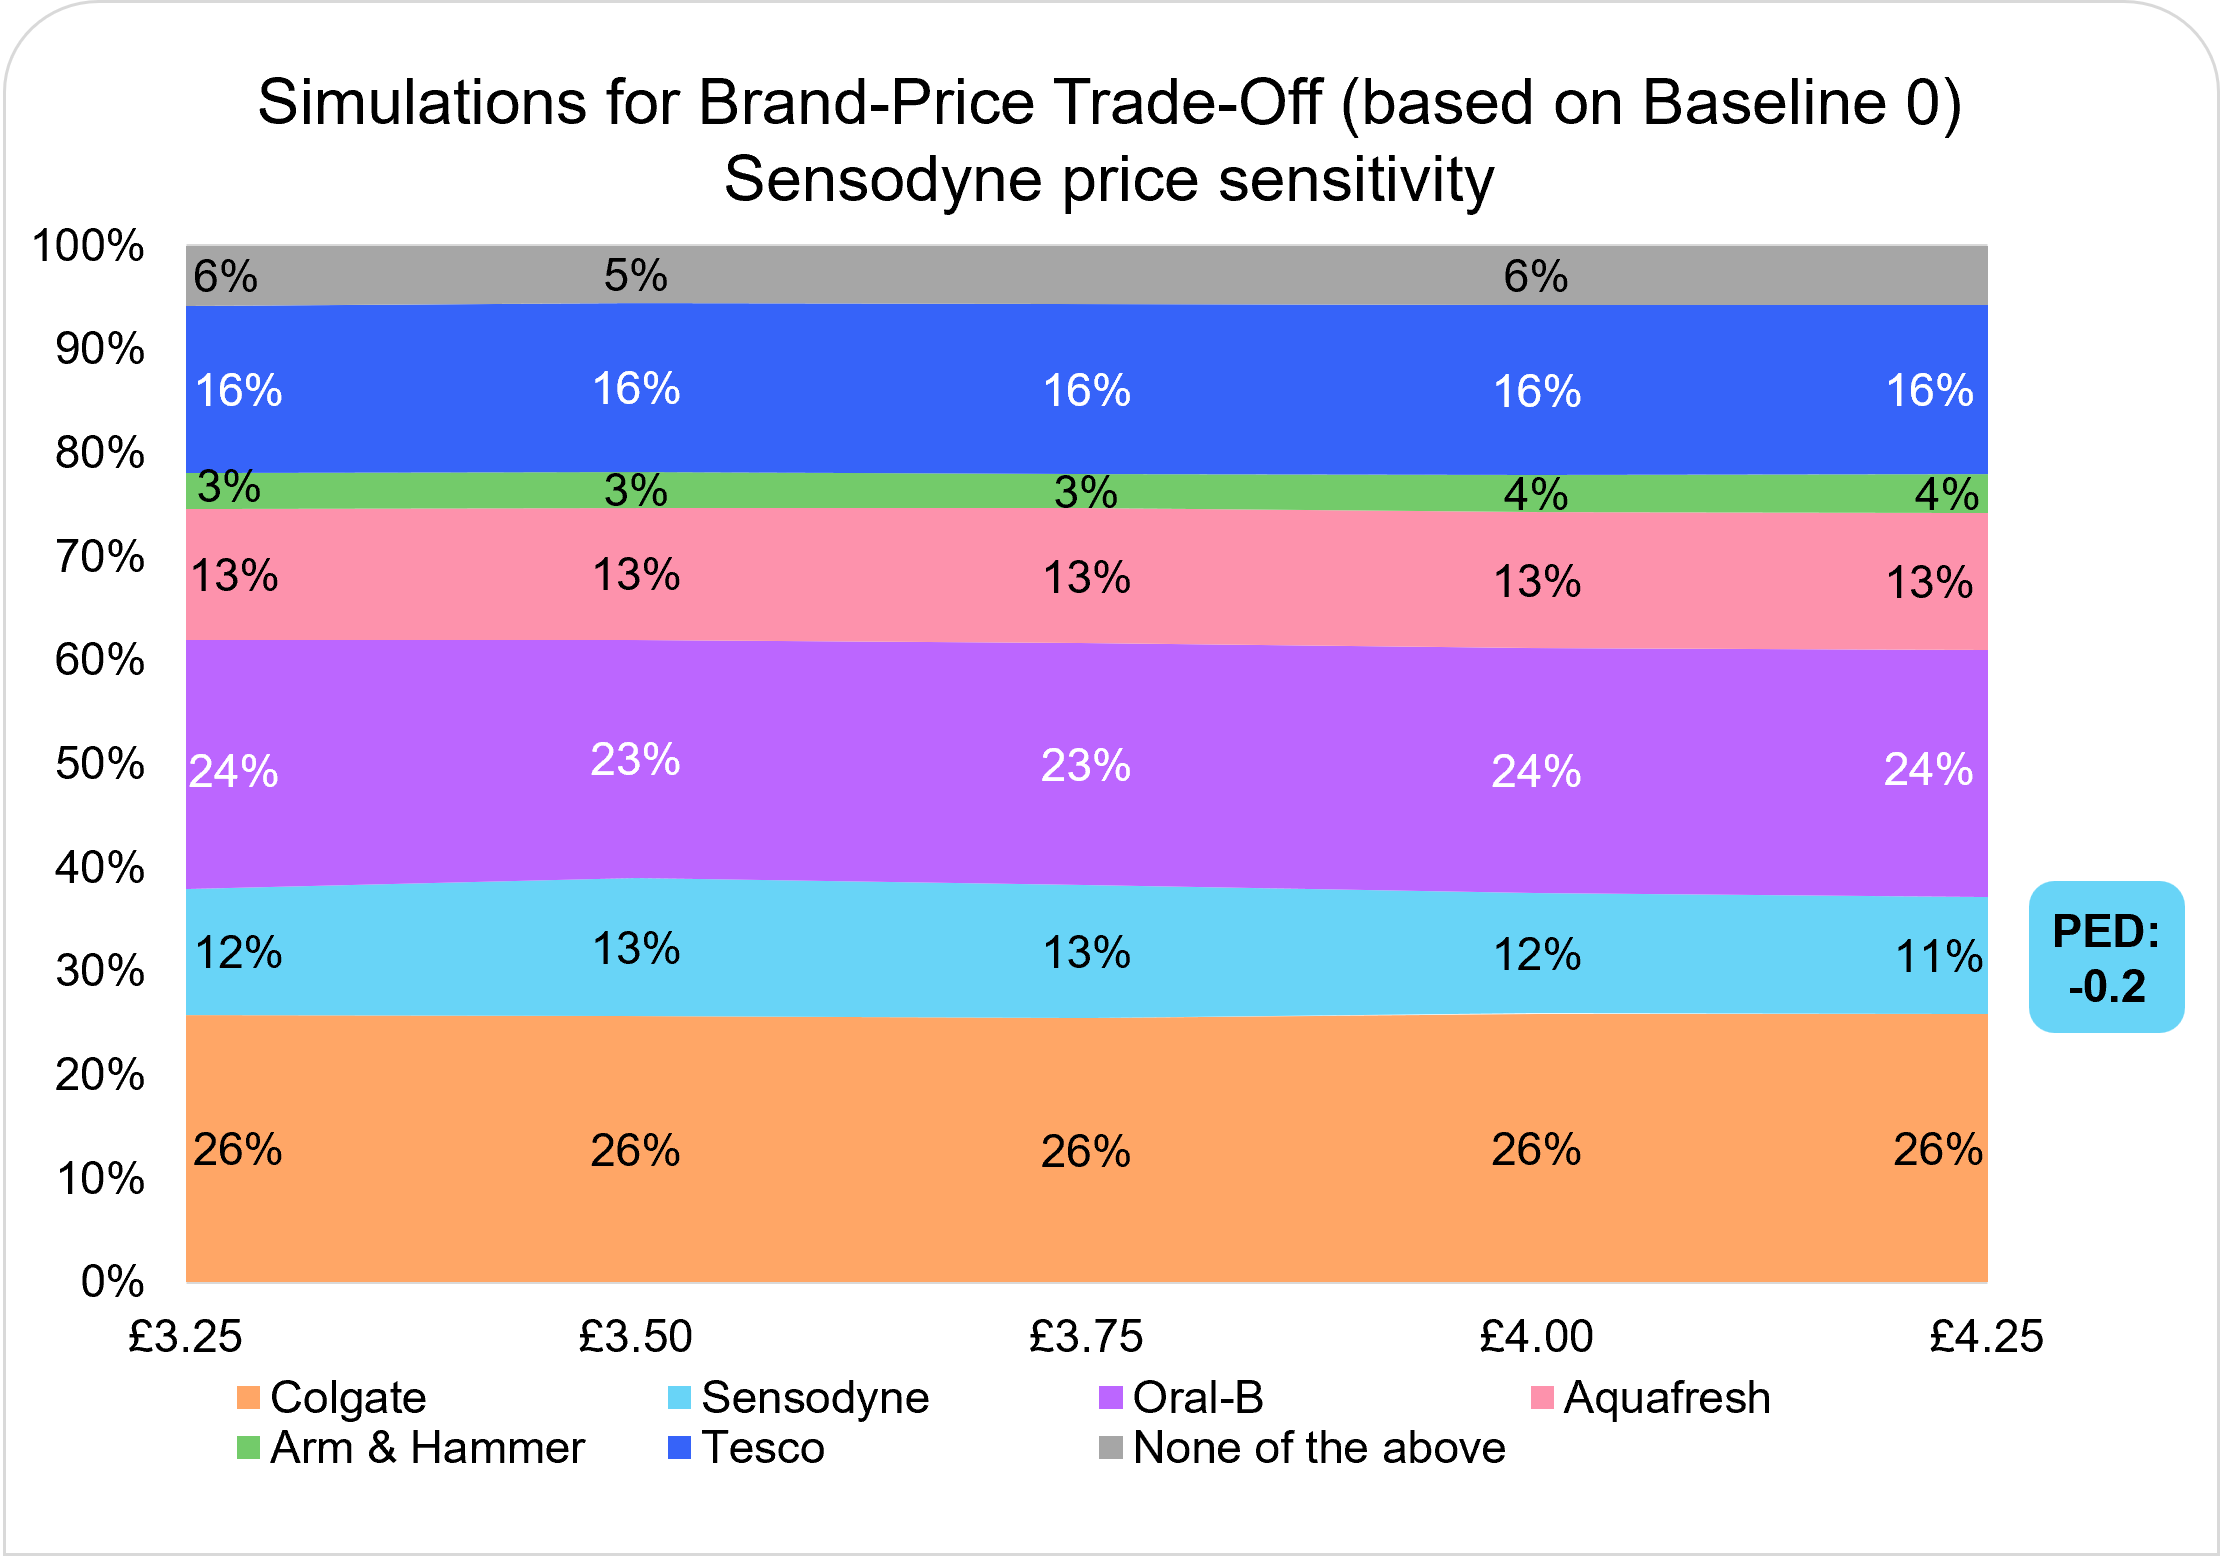
| Sensodyne | -1.0 | -0.2 | -0.3 | -1.5 | -1.0 | -0.1 | -0.3 | -1.5 | £3.25 - £4.25 |
| Oral-B | -2.1 | -1.5 | -2.8 | -1.3 | -2.2 | -1.6 | -2.8 | -1.5 | £2.00 - £3.00 |
| Aquafresh | -2.5 | -2.2 | -2.6 | -2.1 | -2.6 | -2.8 | -2.8 | -2.4 | £1.75 - £2.75 |
| Arm & Hammer | -2.3 | -1.6 | -2.5 | -1.6 | -2.4 | -1.6 | -2.5 | -1.7 | £2.25 - £3.25 |
| Tesco | -0.7 | -0.3 | -0.6 | -0.5 | -0.7 | -0.2 | -0.5 | -0.5 | £0.75 - £1.75 |
| Average | -1.7 | -1.2 | -1.7 | -1.4 | -1.8 | -1.3 | -1.7 | -1.5 | |
Price sensitivity to the price of Colgate
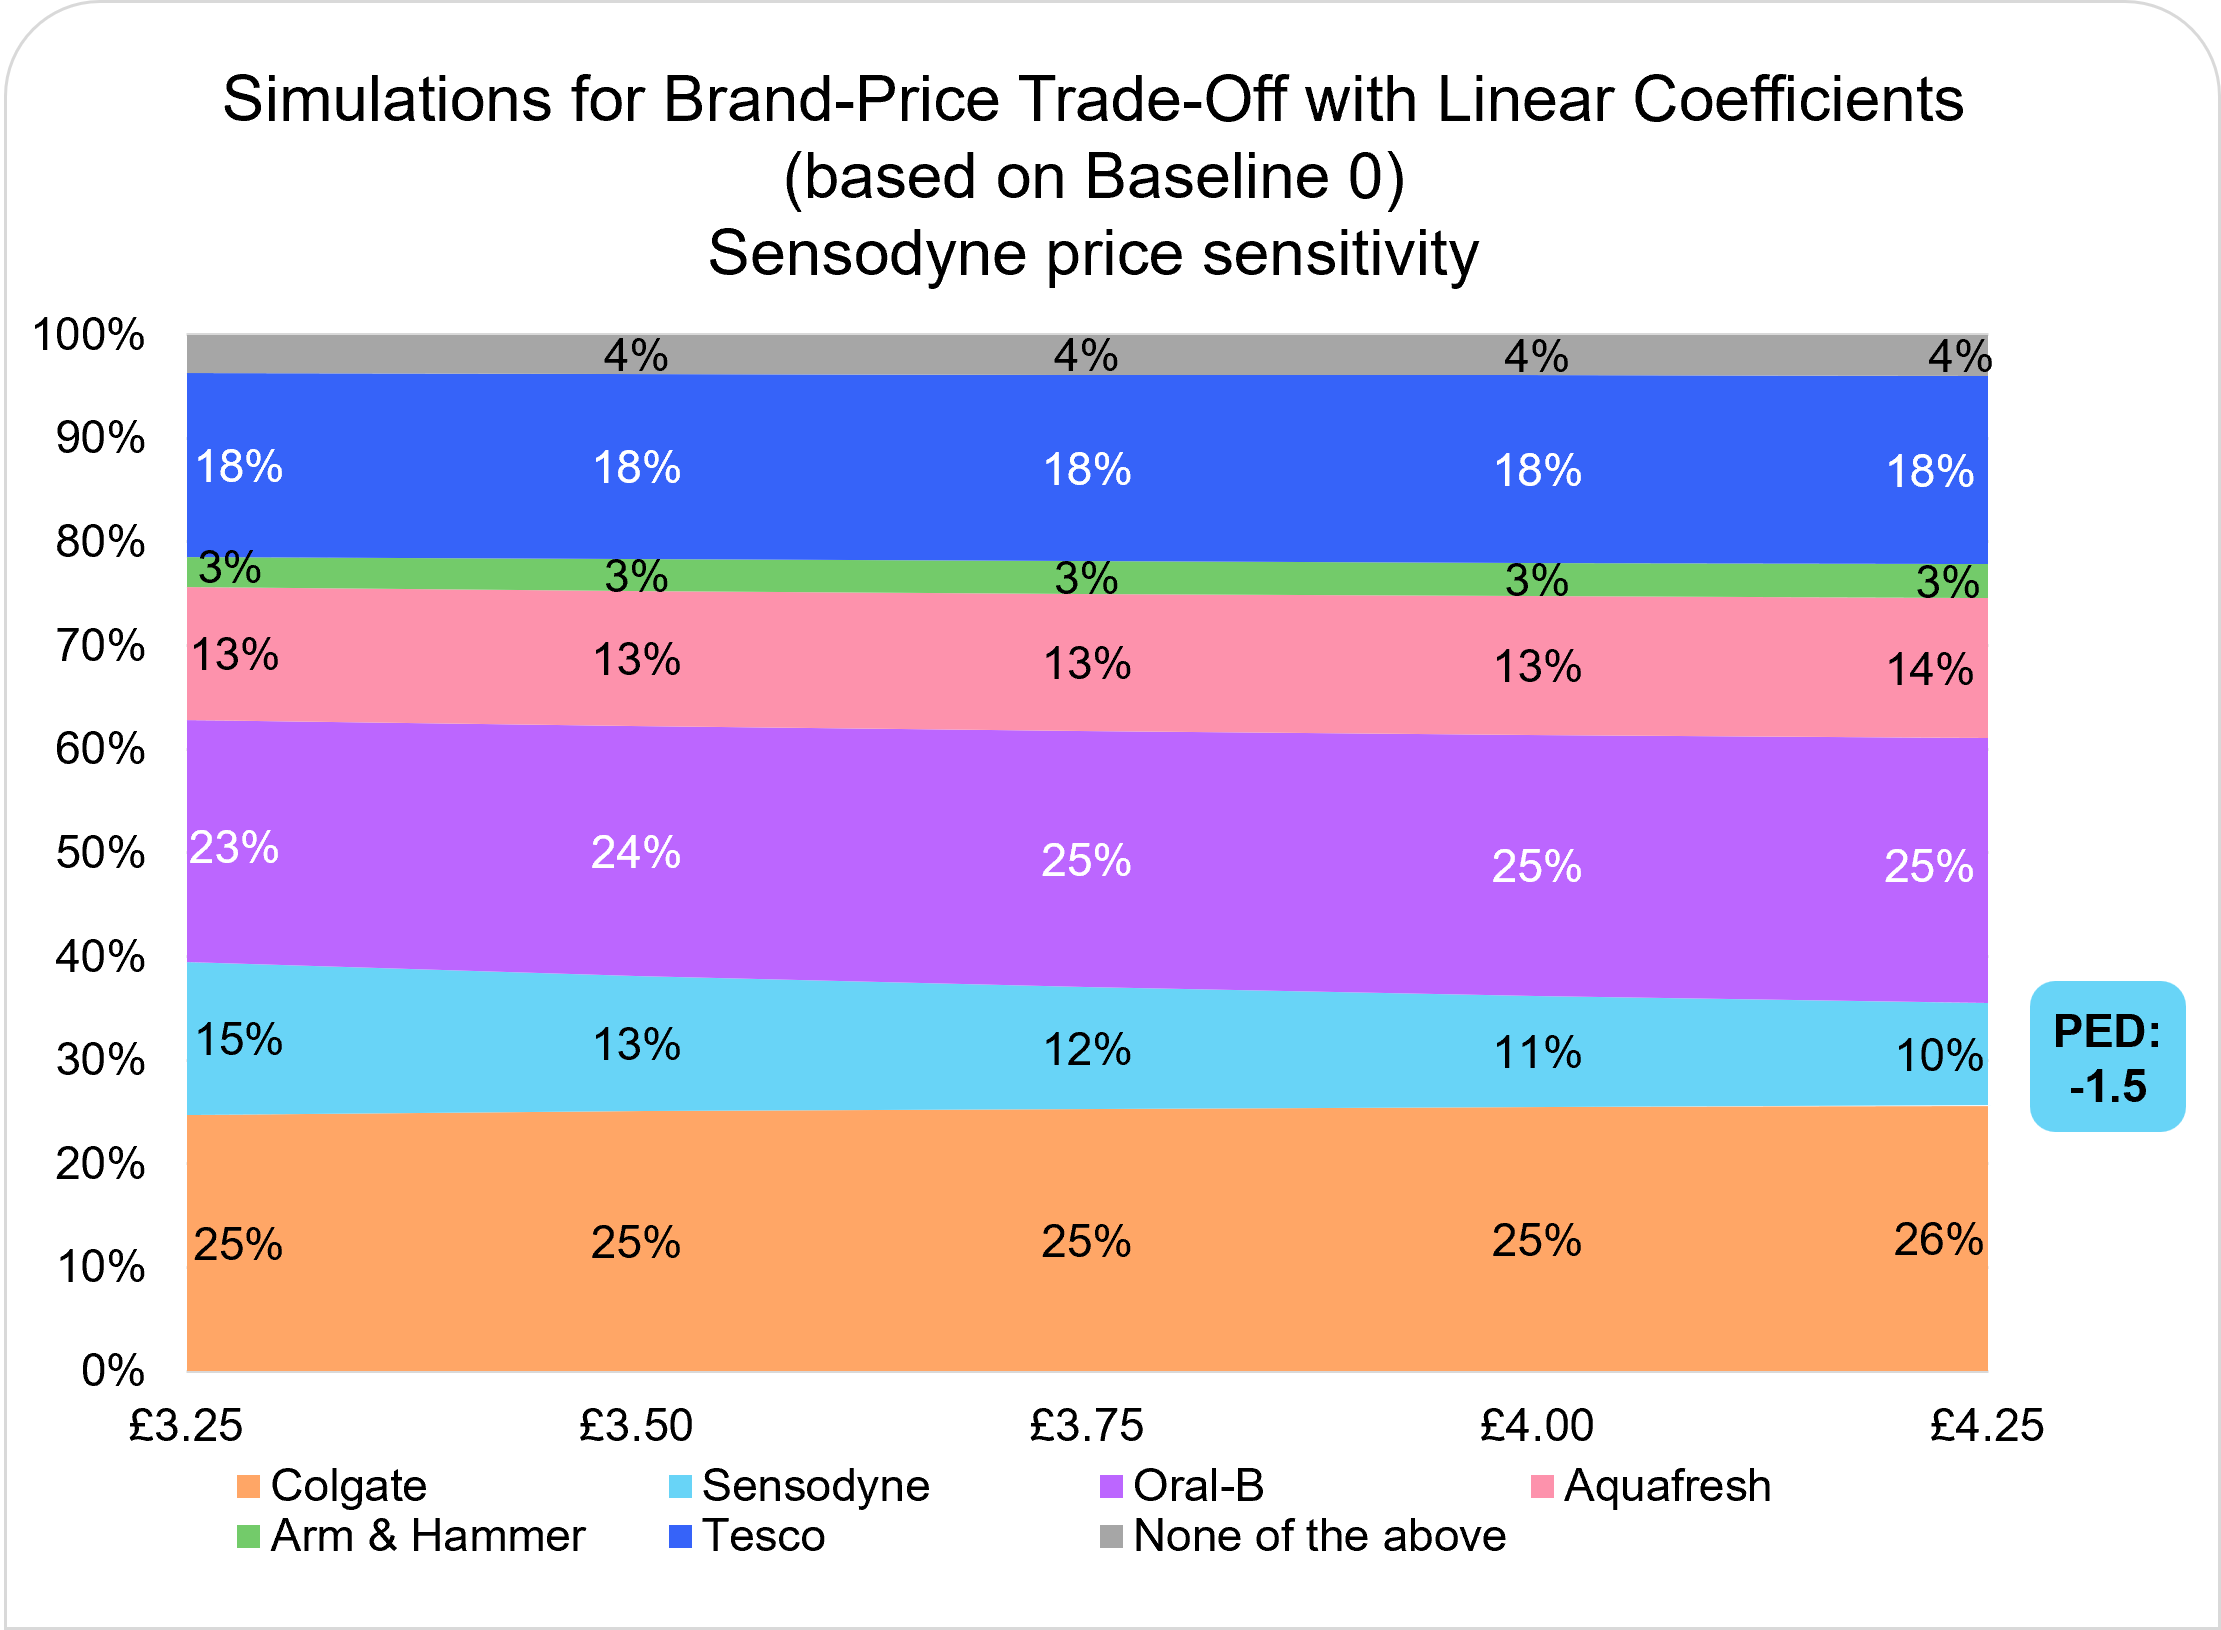
Price sensitivity to the price of Sensodyne
Conclusions
We conducted four conjoint-based pricing studies, and presented results for two baseline scenarios.
- We observe that the simulations produce similar results across all four approaches. Differences can be attributed to samples of distinct cross sections.
- PED for Sensodyne varies the most with the change of methodology.
- Sensodyne emerges as the brand with the highest premium perception based on the diagnostic questions. Open ended feedback also reveals that it caters to a more specific consumer group, those with sensitive teeth. It’s not unusual to observe more inelastic demand in such cases.
- Premium perception of Sensodyne varies across studies, with the GC sample of respondents having the lowest premium perception. We speculate that the variance in premium perception might help explain the variance of PED for Sensodyne.
- We also speculate that methodological differences might have played a role in the variance of PED for Sensodyne. GC outcomes are expected to be more centered around an overall average compared to BSC and BPTO since the latter two are more identified at a granular level. This might have led the outputs for Sensodyne to be closer to the overall average in GC compared to BSC and BPTO.
- Although all methods can be used for pricing conjoints, Brand-Price Trade-Off offers more flexibility and avoids some of the caveats other methods may present.
We address some methodological concerns and caveats in the conjoint set-up below.
Addressing methodological concerns
- Because of how GC is modelled (i.e. midrange price points are coded as 0), it is expected that variations from the price points (both positive and negative) will result in increase in share. We do not observe that effect in this test.
- Because there are more coefficients in BSC, we expect results to be less stable. We do not observe that effect in this test.
- BPTO without linear price coefficient (i.e. where prices are modelled as threshold coefficients and additional Gabor-Granger-like filter is layered on top of the simulations) is expected to produce strongest PEDs. We do not observe that effect in this test.
Caveats in set-up
- Generic Conjoint uses conditional view to set up the price schedule, whereas specific price points are chosen per each brand in other studies. Underlying prices in GC are normalized around unit price 1. For example, in the study underlying prices for GC were 0.8, 0.9, 1, 1.1, and 1.2. Unfortunately, this leads to a significant caveat in calculation of Price Elasticity of Demand. PED in the report is calculated based on the underlying prices, thus whenever the percentage change in the underlying prices and displayed prices don’t match the results will be different. In such cases, PED should be calculated off the platform using the actual prices. Other methods don’t have the same caveat.
- Simulations for Brand-Specific Conjoint only accept prices that are prespecified in the design stage, whereas other methods allow simulations based on any price within an appropriate range.
- Brand-Price Trade-Off offers more flexibility overall.
Appendix
| Generic Conjoint (GC) | Brand Specific Conjoint (BSC) | Brand-price trade-off (BPTO) |
|---|---|---|
| When to use? (Objective) | ||
When aiming to understand consumers' preference for various features (attributes & levels) of a product from a single brand. Typically not used for competitive context, but it can be if the product features are similar across brands | When aiming to test products with varying attributes and levels in a competitive context To understand the impact of changes in attributes/levels on projected preference shares/revenue/volume. | When aiming to test the introduction of NPD(s) or find out the optimal pricing for your products within a competitive context (usually with a large list of competitive SKUs). |
| Setup and what respondents see | ||
Creates hypothetical concepts "randomly" shown to respondents, rather than realistic attribute combinations. Ideal for estimating consumer preferences. If looking for more realistic choice-sets, consider switching to a Brand-Specific Conjoint. | Creates realistic product concepts by setting up different levels of features and prices by brand/SKU. For tailored product concepts, as this approach uses only relevant attribute levels per brand in the conjoint exercise. | Enables realistic shelf comparisons with relevant price ranges by brand/SKU and simulates the impact of product awareness through advertisements. For accurate product concepts, as only relevant price levels are paired with the brand/SKU in the conjoint exercise. |
| Design complexity | ||
Relatively simpler and requires smaller sample size | Design can be more complex in nature and requires larger sample | Design can become more complex depending on the number of SKUs and price points tested, requiring a moderate sample size |
| Partworth utilities | ||
For every attribute levels respectively | Differentiated by brand/SKU | Differentiated by brand/SKU - only for BPTO with Linear Coefficients |
| Outputs | ||
Available:
| Available:
Not available:
| Available:
Not available:
|


