
You can perform diagnostic assessment on claims either through an individual claim approach or a combined concept approach, but which approach is more suitable?
It is a common practice to perform diagnostic assessment on claims in a Claims Test to understand consumers’ perceptions of each claim across various dimensions, such as relevance, attractiveness, and premiumness. The most straightforward approach to diagnostic assessment is to assess each claim independently as an individual stimulus (i.e. the individual approach). This ensures that respondents’ perceptions and attitudes are directed solely at the claims being tested, without influence from the other claims.
Alternatively, you can also combine several claims from different categories to form a product concept for the diagnostic assessment (e.g. the combined approach). This approach offers a more realistic perspective for evaluating claims effectiveness, as a product typically features multiple claims. However, it is more difficult to evaluate the effectiveness of each claim in the combination separately.
You may then ask, which approach is more suitable for diagnostic assessment? While there is no definitive answer, the Conjointly team attempted to address the difference between both approaches through the following study.
Background of study
We conducted a Generic Conjoint study to understand consumers’ perceptions of yoghurt among 1,201 people from the US general population. After the conjoint exercise, respondents were asked to evaluate the claims on their premiumness and naturalness using a Monadic Test. However, about half of the respondents were asked to evaluate the claims individually, while the other half were exposed to combinations of claims instead.
Individual approach
616 respondents were asked to evaluate 12 product claims across three categories, namely flavours, reasons to believe(RTB), and benefits. Each claim was evaluated individually as follows:
- Flavours:
- Strawberry flavour
- Vanilla flavour
- Chocolate flavour
- Reasons to believe:
- With Bifidobacteria
- With Lactobacillus
- With vitamins and minerals
- Benefits:
- Easy on your stomach
- Helps digestion
- “Feel the traditional touch”
For each claim above, respondents were asked the following questions:
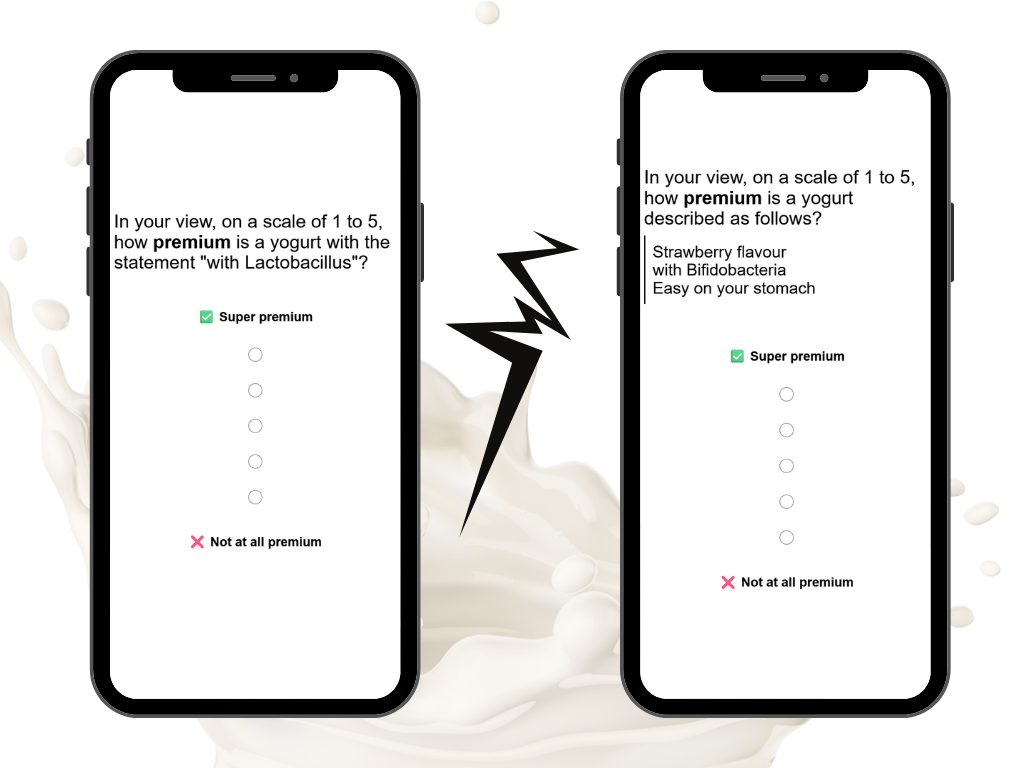
Premiumness: In your view, on a scale of 1 to 5, how premium is a yoghurt with the statement “[Claim]”?
1: Not at all premium; 5: Super premiumNaturalness: In your view, on a scale of 1 to 5, how natural is a yoghurt with the statement “[Claim]”?
1: Neither natural, nor unnatural; Purely natural
Combined approach
585 respondents were asked to evaluate 9 claims combinations, with each combination assessed individually. These combinations were systematically selected from the full set of 27 possible combinations (3 flavours × 3 reasons to believe × 3 benefits) using an orthogonal design.
The orthogonal design was used to reduce respondent burden while maintaining statistical rigour by ensuring:
- Each individual claim appears exactly 3 times across all combinations.
- Statistical independence between claim categories (flavour, reason to believe, and benefits).
This approach ensures all claims are evenly represented and assessed independently across combinations.
The 9 combinations evaluated were:
- Strawberry flavour, with Bifidobacteria, Easy on your stomach
- Vanilla flavour, with Bifidobacteria, Helps digestion
- Chocolate flavour, with Bifidobacteria, “Feel the traditional touch”
- Strawberry flavour, with Lactobacillus, Helps digestion
- Vanilla flavour, with Lactobacillus, “Feel the traditional touch”
- Chocolate flavour, with Lactobacillus, Easy on your stomach
- Strawberry flavour, with vitamins, and minerals, “Feel the traditional touch”
- Vanilla flavour, with vitamins and minerals, Easy on your stomach
- Chocolate flavour, with vitamins and minerals, Helps digestion
For each claim combination above, respondents were asked the following questions:
- Premiumness: In your view, on a scale of 1 to 5, how premium is a yoghurt described as follows? “[Claim combination]"
1: Not at all premium; 5: Super premium - Naturalness: In your view, on a scale of 1 to 5, how natural is a yoghurt described as follows? “[Claim combination]"
1: Neither natural nor unnatural; 5: Purely natural
Results
Individual approach

As shown in the table above, respondents showed some interesting perceptions toward the claims. Let’s break them down:
- Flavour: Strawberry and vanilla flavour have similar mean and top 2 box ratings for premiumness and naturalness compared to the average ratings. However, the chocolate flavour has lower ratings than average as well as compared to the other two flavours.
- Reason to believe (RTB): Claims about Bifidobacteria and Lactobacillus do not perform better than average, while the claims about vitamins and minerals have higher ratings than average.
- Benefit: Both “Easy on your stomach” and “Helps digestion” perform better than average, while the claim “Feel the traditional touch” does not perform better than average.
From the results above, we can draw the following inferences:
- Consumers are less likely to view chocolate flavour as being premium and natural
- Consumers will perceive a claim with more familiar and understandable ingredients (e.g. vitamins and minerals) more positively than claims with Bifidobacteria and Lactobacillus
- Consumers will perceive a claim with a concrete and specific benefit (e.g. easy on your stomach) more positively than a claim with vague phrasing (e.g. Feel the traditional touch)
Combined approach

As shown in the table above, most of the combined claims do not perform too differently than average. The only outstanding outcome is that the claim “Chocolate flavour, with Bifidobacteria, Feel the traditional touch” performs worse than average. This observation is consistent with the inferences drawn from the individual approach.
Additional analyses to assess individual claims
We also ran additional analyses in an attempt to assess each individual claim from the combined claims. We explored a few regression models using both the Likert scale rating (i.e. 1 to 5) and Top 2 rating categorisation (i.e. YES = rating of 4 and above, NO = rating of 3 and below).
After comparing across the models, we concluded that the models with better performance are the mixed-effects logistic regression models with random intercept (i.e. allowing respondent-level variation in the baseline) and use the Top 2 rating categorisation as the outcome variable.

Based on the table above, the models have very little Marginal R2, indicating that there is little contribution from the fixed effects (i.e. the individual claims). Indeed, looking at the individual claims:
- In the model for premiumness, only the claims “Chocolate flavour” and “Feel the traditional touch” show statistically significant odds ratios; Respondents are less likely to rate 4 or 5 on combined claims with those individual claims included (i.e. odds ratio < 1).
- In the model for naturalness, only the claim “Chocolate flavour” shows a statistically significant odds ratio; Respondents are less likely to rate 4 or 5 on combined claims with it included (i.e. odds ratio < 1).
Comparison of results
The individual approach shows a clear and discriminatory result that reveals respondents’ perceptions for each individual claim. We can quickly observe the differences, such as chocolate flavour being perceived as less premium and natural. This helps us make decisions in selecting the best claims from each category (e.g. flavours, RTBs, and benefits).
On the other hand, the combined approach allows us to assess the claims combinations in a more realistic and holistic view. However, as respondents are prone to rate the combined claims as a whole, it is more difficult to identify the contribution from the individual claims. From the output, we can only observe that the combined claim “Chocolate flavour, with Bifidobacteria, Feel the traditional touch” is rated lower than the others across metrics. The additional modelling done on the combined claims reveals more insight - respondents would rate lower scores on combined claims if “Chocolate flavour” and “Feel the traditional touch” are part of the claim.
Nevertheless, both approaches capture similar respondent perceptions, particularly that the chocolate flavour is seen as less premium and natural compared to the other flavours.
Conclusion
In summary, the individual approach can show a clear diagnostic assessment of each claim, while the combined approach offers a more holistic perspective on how claims work together. Each approach yields different insights depending on your objectives:
- If you are still in the process of filtering or selecting claims, we recommend using the individual approach to help you identify the useful claims.
- If you already have a shortlist of claims, and are more interested in finding the optimal ways to present them together, then the combined approach is more appropriate.