
This study investigates the claim that synthetic LLM-generated data could be used effectively for creating perceptual maps in market research contexts.
This study seeks to replicate the analysis from “Language Models for Automated Market Research: A New Way to Generate Perceptual Maps” by Peiyao Li et al., which suggested that synthetic LLM-generated data could be used effectively for creating perceptual maps in market research contexts. Specifically, we aim to test this claim in the context of two cases:
- Perceptions of Super Rugby teams among New Zealanders, and
- Perceptions of popular café chains among Australians.
Our overarching goal is to examine whether synthetic perceptual data derived from large language models provides similar insights to real human survey data in mapping perceptions. In addition to testing the original claims, we also compare results from multiple synthetic data generation methods, including different GPT models and fully simulated fake datasets based on simple heuristics.
The specific research questions we seek to address are:
- How well do perceptual maps and similarity/distance matrices constructed using synthetic data from AI models correlate with those from real human surveys?
- Do the synthetic insights deteriorate or become less reliable when moving to a context further away from the training data of the models?
Through this replication, we aim to provide empirical evidence on both the promises and limitations of leveraging LLM-generated synthetic data to understand consumer perceptions and preferences. Our findings have important implications for whether techniques like generative language models can be effective market research tools or if more scrutiny is warranted before relying on their insights.
Methodology
To replicate the original study, we employed both real human surveys and synthetic data generation using AI models for two cases: Super Rugby teams and Australian café chains.
For the Super Rugby case, we collected online survey responses from 465 nationally representative New Zealanders. Participants were presented with open-ended questions asking to complete sentences of the form "The Super Rugby team XYZ is similar to the Super Rugby team ...". This allowed us to construct perceptual maps and similarity matrices based on the human data.
We then used several AI models GPT-3.5, GPT-4, and GPT-4 Turbo to generate synthetic completions for the same open-ended prompts on Super Rugby team similarities. The models were provided with a set of 12 popular teams to focus the perceptual mapping task. In addition to the AI-generated data, we also constructed fully simulated fake datasets using simple rules based on the countries of the teams.
The café chain case followed a similar methodology, with real human survey data collected from 157 Australian participants on their perceptions of 9 major café brands in the country. The synthetic data techniques remained the same as the rugby case, with multiple GPT model variants used to create perceptual data. Here we also introduced two extra datasets based on our team member's judgments, serving as proxy for some simple knowledge on café similarities.
Across both contexts, we were able to construct multiple perceptual maps spanning real human surveys and various types of synthetic datasets, from fake AI-generated data to fake heuristics-based data. Finally, we compared the maps themselves qualitatively and also calculated similarity/distance matrices to quantify the correlations between real and synthetic data sources on brand perceptions.
All code and data used in this study are available in this GitHub repository.
LLM-based fake data generation
Here is a summary of how the synthetic perceptual data was generated:
Super Rugby teams:
- A list of 12 popular Super Rugby franchises was prepared.
- The system context prompt was “You are a New Zealander.”
- For each team, an incomplete sentence prompt was created like "Please continue the following sentence: The Super Rugby team XYZ is similar to the Super Rugby team ".
- Models like GPT-3.5, GPT-4, GPT-4 Turbo were invoked in the chat mode to generate completions to these prompts.
- 100 completions were obtained for each prompt-brand combination with the temperature parameter set to 1.
- These were processed to create a similarity matrix between brands based on co-occurrence frequencies.
Australian cafes:
- A list of 9 major Australian café chains was prepared.
- The system context prompt was “You are an Australian. You will now be asked several questions about Australian cafe chains.”
- Prompts of the form "Please continue the following sentence: The cafe chain %s is similar to the cafe chain" were generated.
- Again 100 completions per prompt were obtained from GPT models with the temperature parameter set to 1.
- A similarity matrix was constructed through post-processing.
So in summary, language models were leveraged to automatically generate textual data mimicking human responses on brand similarities. These were then turned into perceptual maps and similarity scores for analysis.
Perceptual maps of Super Rugby teams
Please see below the different perceptual maps and try to guess which one was real:
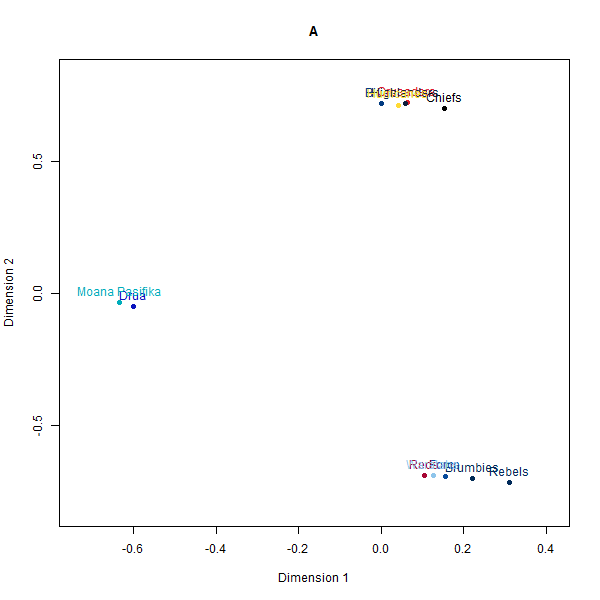
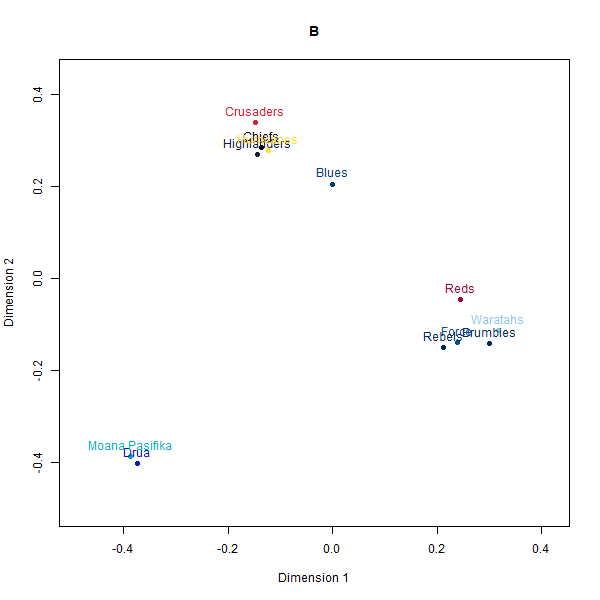
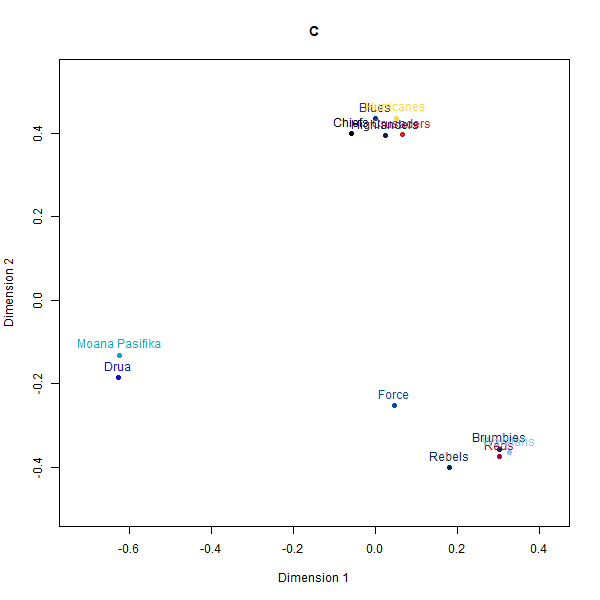
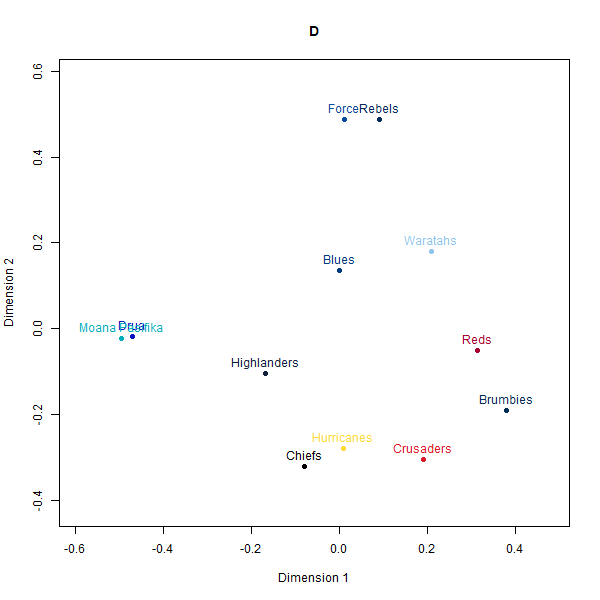
- A: Country-based data
- B: Real data
- C: GPT-4
- D: GPT-3.5-Turbo
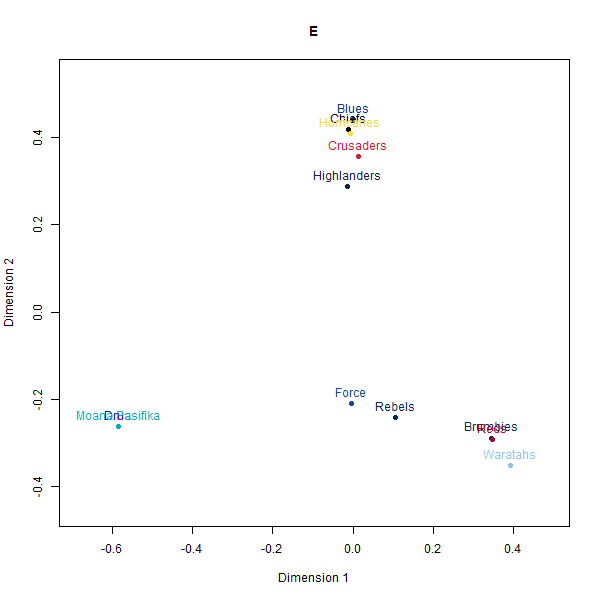
- E: GPT-4-Turbo
The perceptual maps constructed from the synthetic rugby datasets visually appear quite similar to the map from the real human survey data. The AI-generated maps and even the simulated fake data broadly preserve the relative positioning and distances between the 12 Super Rugby franchises.
However, a deeper look at the similarity matrices reveals some limitations. The alignments seem to be primarily driven by the geography-based locations of the teams.
Correspondence of most similar brands
| Country-based data (A) | GPT-3.5-Turbo (D) | GPT-4 (C) | GPT-4-Turbo (E) | |
|---|---|---|---|---|
| GPT-3.5-Turbo (D) | 17% | |||
| GPT-4 (C) | 58% | 33% | ||
| GPT-4-Turbo (E) | 50% | 25% | 67% | |
| Real (B) | 42% | 33% | 83% | 50% |
Correspondence of least similar brands
| Country-based data (A) | GPT-3.5-Turbo (D) | GPT-4 (C) | GPT-4-Turbo (E) | |
|---|---|---|---|---|
| GPT-3.5-Turbo (D) | 8% | |||
| GPT-4 (C) | 8% | 8% | ||
| GPT-4-Turbo (E) | 17% | 17% | 17% | |
| Real (B) | 8% | 25% | 25% | 8% |
For instance, New Zealand and Australian teams cluster closer to teams from their own country rather than performance-related perceptions that real rugby fans rely on. And within the country clusters, the distance relationships also seem randomly generated rather than any meaningful rugby specifics.
So while at a superficial level, the AI-constructed maps look persuasively realistic, they seem to just be latching on to the easiest heuristic of team geography which would be common knowledge. When comparing the actual closest and furthest teams for a given target team between datasets, we observe wider divergences.
It is consistent with the hypothesis that while generative AI models can produce perceptual maps that look credible, researchers should exercise caution before extrapolating any subtle or non-surface insights. There remain risks around overinterpreting the persuasive maps, especially if they incorporate dynamics outside the training distributions.
Perceptual maps of Australian cafe chains
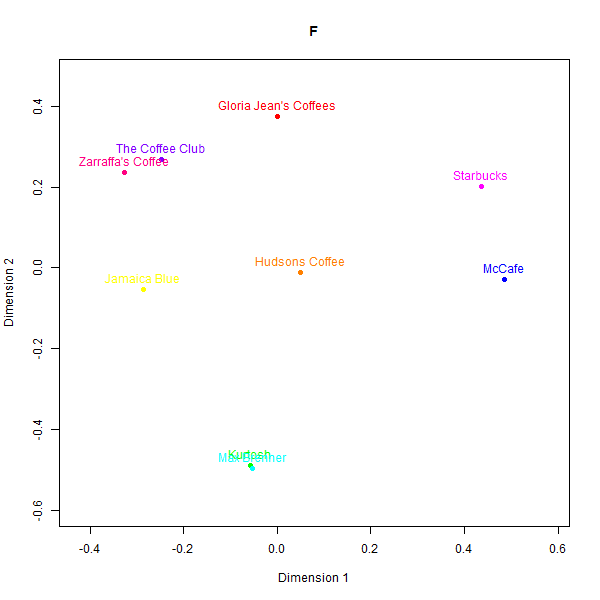
In contrast to the rugby case, the perceptual maps for the Australian cafés case exhibit larger divergences across the different data sources. Please see below the different perceptual maps and try to guess which one was real:
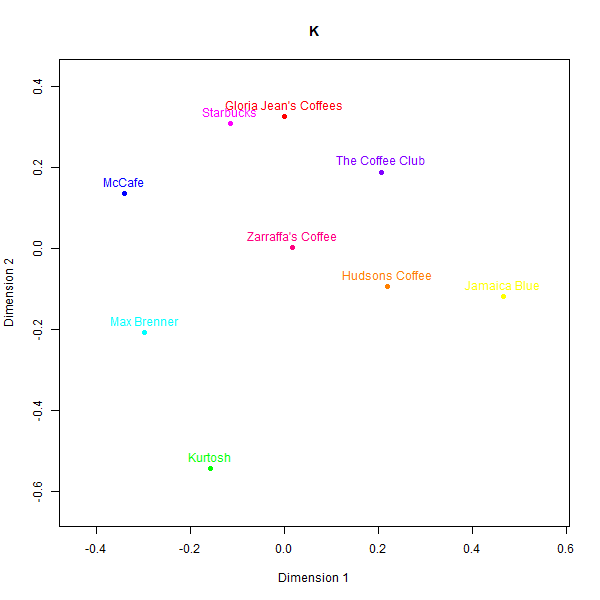
This is what the labels mean:
- F: GPT-3.5-Turbo
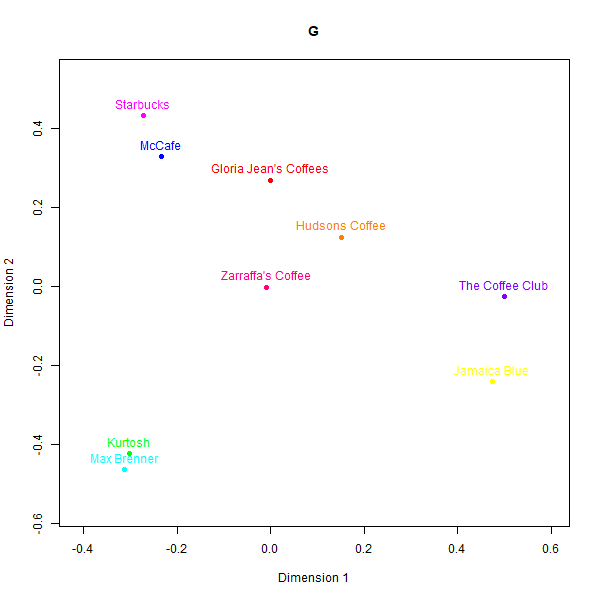
- G: GPT-4
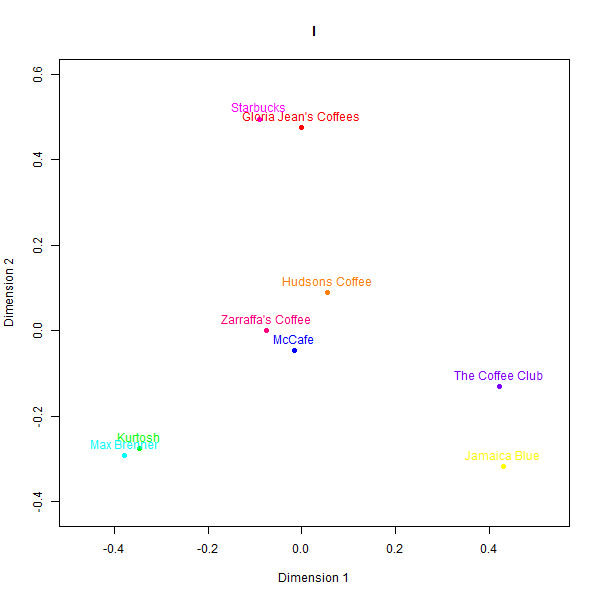
- I: GPT-4-Turbo
- K: Real data
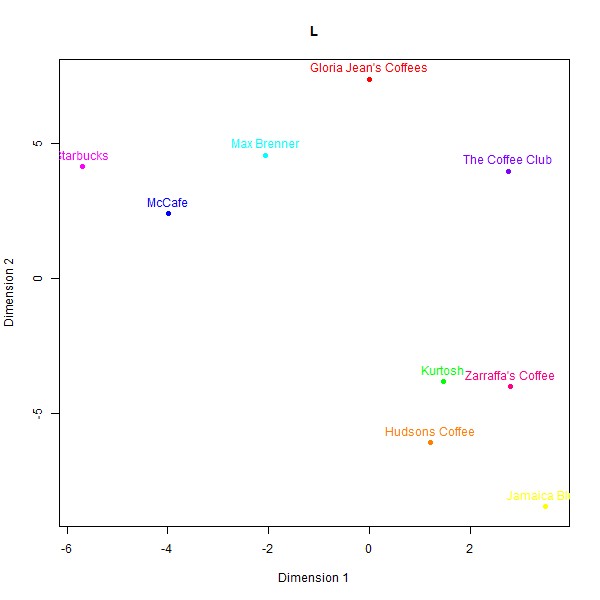
- L: Judgement from the first team member
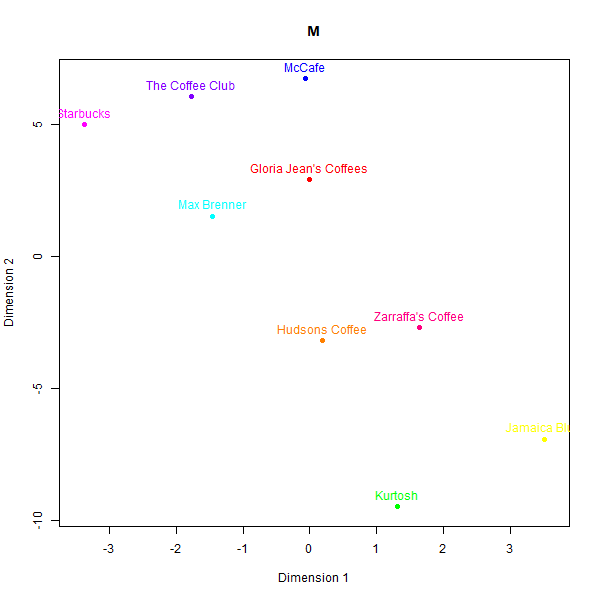
- M: Judgement from the second team member
While some basic clusters are preserved, such as separating out high-end cafés from fast food chains, the relative positioning of brands and inter-brand distances show substantial dissimilarity versus the human survey benchmarks.
What is also clear from analysing correspondence between the similarity matrices is that models do not always agree with one another.
Correspondence of most similar brands
| GPT-3.5-Turbo (F) | GPT-4 (G) | GPT-4-Turbo (I) | First team member (L) | Second team member (M) | |
|---|---|---|---|---|---|
| GPT-4 (G) | 78% | ||||
| GPT-4-Turbo (I) | 56% | 56% | |||
| First team member (L) | 0% | 0% | 0% | ||
| Second team member (M) | 0% | 0% | 0% | 11% | |
| Real (K) | 56% | 44% | 44% | 0% | 0% |
Correspondence of least similar brands
| GPT-3.5-Turbo (F) | GPT-4 (G) | GPT-4-Turbo (I) | First team member (L) | Second team member (M) | |
|---|---|---|---|---|---|
| GPT-4 (G) | 44% | ||||
| GPT-4-Turbo (I) | 44% | 44% | |||
| First team member (L) | 0% | 0% | 0% | ||
| Second team member (M) | 0% | 0% | 0% | 0% | |
| Real (K) | 44% | 44% | 11% | 0% | 0% |
The low similarity between real and synthetic maps is appreciable even for the best-aligned output (GPT-4). Even though three groups of high-end cafes (Kürtősh and Max Brenner), fast food (Gloria Jeans, Starbucks and McCafe), and Australian chains can be interpreted in both, the distances of brands within these groups are not preserved. Some brands like the Coffee Club are placed in vastly different vicinities.
We believe two factors drive these discrepancies:
- The training datasets for current synthetic models under-represent niche contexts like Australian cafés which people have nuanced cultural associations with.
- Models over-extrapolate basic heuristics like assuming cafés fall on a simple spectrum from mass-market to premium. Real perceptions likely have multifaceted tradeoffs between quality, convenience, price etc.
In summary, while rugby perceptions could be approximated through geography and random noise, cafés proved more challenging synthetic data territory. The findings align with our hypothesis ‐ as AI models move farther away from their training distributions, the perceptual outputs grow less reliable. This underscores the risks of overinterpreting seemingly credible but inaccurate synthetic datasets for market research.
As for why there is so little resemblance of our team members’ perceptual maps to real data, we believe it is because they were not given any specific instructions on how to construct the maps. They were simply asked to create a perceptual map of the 9 café chains in two minutes. This is a good example of how laypersons’ judgement can be misleading. It shows that fake LLM data (which took several hours to code) may be more reliable than laypersons’ judgement (which took two minutes to generate).
Conclusions
This replication study provided mixed evidence on the potential for using synthetic LLM-generated data in market research applications like perceptual mapping.
In cases very close to the training data distributions like geography-driven rugby team perceptions, the synthetic maps and similarity matrices correlate reasonably well with real human surveys. However, the techniques seem to just latch on to simple heuristics, not deeper perceptual relationships.
As we move to (likely) less well-represented contexts like Australian café chains, the alignment between real and synthetic-based perceptual outputs decreases substantially. Models seem to over-extrapolate basic rules which fail to capture nuanced associations real consumers make.
Because few (if any) LLM providers currently publish comprehensive datasheets for datasets for their language models, it is difficult to know if a model may help at all investigate a given scenario.
In addition to that, we observed that results from different models (even though all three were provided by OpenAI) produced divergent results, especially in the second study. Thus, even if one were to trust LLM-generated data, they would struggle to pick a suitable model for fake data generation.
Placing faith in fully automated LLM-generated market research appears premature.